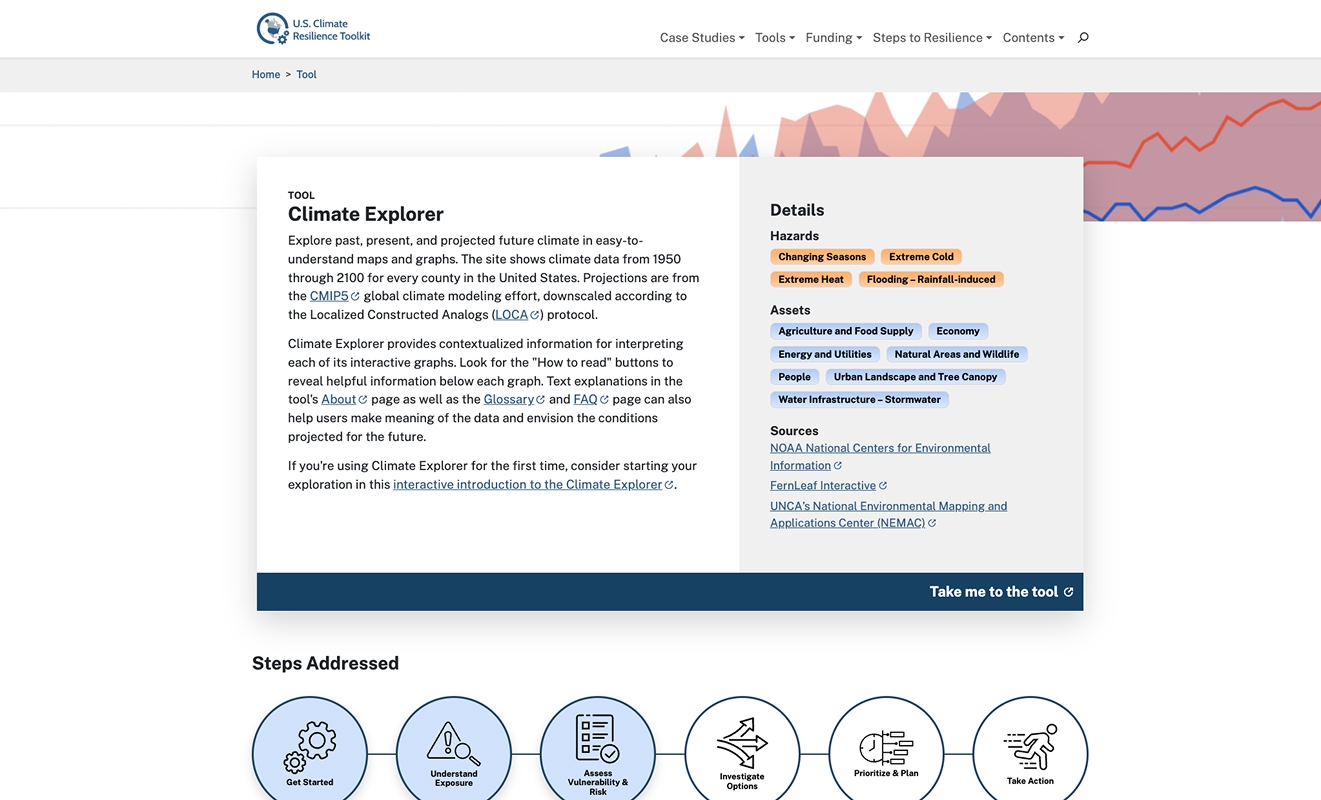
NOAA Climate Explorer is a comprehensive, free web-based tool that provides access to climate data visualizations and analysis capabilities for understanding past, present, and projected climate conditions across the United States.
Developed by NOAA's National Centers for Environmental Information (NCEI), this tool offers both historical climate observations and future climate projections from leading climate models, making it essential for climate risk assessment, adaptation planning, infrastructure design, and research.
Whether you're a researcher, planner, consultant, or decision-maker, NOAA Climate Explorer provides accessible, authoritative insights into climate trends and projections for communities across America.
1. Free Access to Comprehensive Climate Data
NOAA Climate Explorer provides completely free access to extensive climate datasets.
- No registration or subscription required
- Web-based interface accessible from any browser
- High-quality, peer-reviewed climate data
- Regular updates with latest observations
This makes it an essential resource for climate analysis and planning.
2. Historical and Future Climate Data
The tool provides access to both observed historical data and climate projections:
Historical Data (1950-present):
- Temperature (daily, monthly, seasonal)
- Precipitation patterns and totals
- Extreme events frequency and intensity
- Drought indicators and trends
Climate Projections (2020-2100):
- Temperature projections under different scenarios
- Precipitation change projections
- Extreme heat and cold projections
- Sea level rise projections (coastal areas)
3. Interactive Visualization Tools
NOAA Climate Explorer features powerful visualization capabilities:
- Interactive maps showing climate data across the US
- Time series graphs for trend analysis
- Comparison tools for different time periods
- Threshold analysis for extreme events
- Downloadable charts and data tables
Users can customize visualizations by location, time period, and climate variable.
4. Climate Risk Assessment Features
The tool supports comprehensive risk assessment:
- Threshold exceedance analysis (e.g., days above 90°F)
- Return period calculations for extreme events
- Trend analysis for identifying changes over time
- Scenario comparison for different emission pathways
- Local vs. regional comparison capabilities
5. Applications Across Sectors
NOAA Climate Explorer is valuable for:
- Agriculture: Crop planning and irrigation management
- Water Resources: Drought and flood risk assessment
- Infrastructure: Design standards and resilience planning
- Health: Heat stress and disease vector analysis
- Energy: Heating/cooling demand projections
- Insurance: Climate risk modeling and pricing
6. Data Export and Integration
The platform offers flexible data access:
- CSV downloads for statistical analysis
- Image exports for reports and presentations
- API access for automated data retrieval
- Integration with GIS platforms and other tools
Getting Started with NOAA Climate Explorer
- Access the web tool at toolkit.climate.gov/climate-explorer2/
- Select your location (state, county, or custom area)
- Choose climate variables (temperature, precipitation, etc.)
- Set time periods for analysis (historical or future)
- Generate visualizations and download data
Use Cases
- Climate Risk Assessment: Analyze exposure to extreme weather
- Adaptation Planning: Identify future climate challenges
- Infrastructure Design: Incorporate climate projections
- Research Projects: Access standardized climate data
- Policy Development: Support evidence-based climate policies
- Education: Teach climate science and impacts
NOAA Climate Explorer democratizes access to authoritative climate data and empowers users to understand and prepare for climate change impacts.