Visualize data with Atlas
Layer styling is essential for making your maps lively and informative. It turns your data into something that's both beautiful and understandable.
Make maps informative, straightforward, and attractive
Enhance your maps with intuitive design and styling tools. Transform complex data into clear, visually appealing maps.
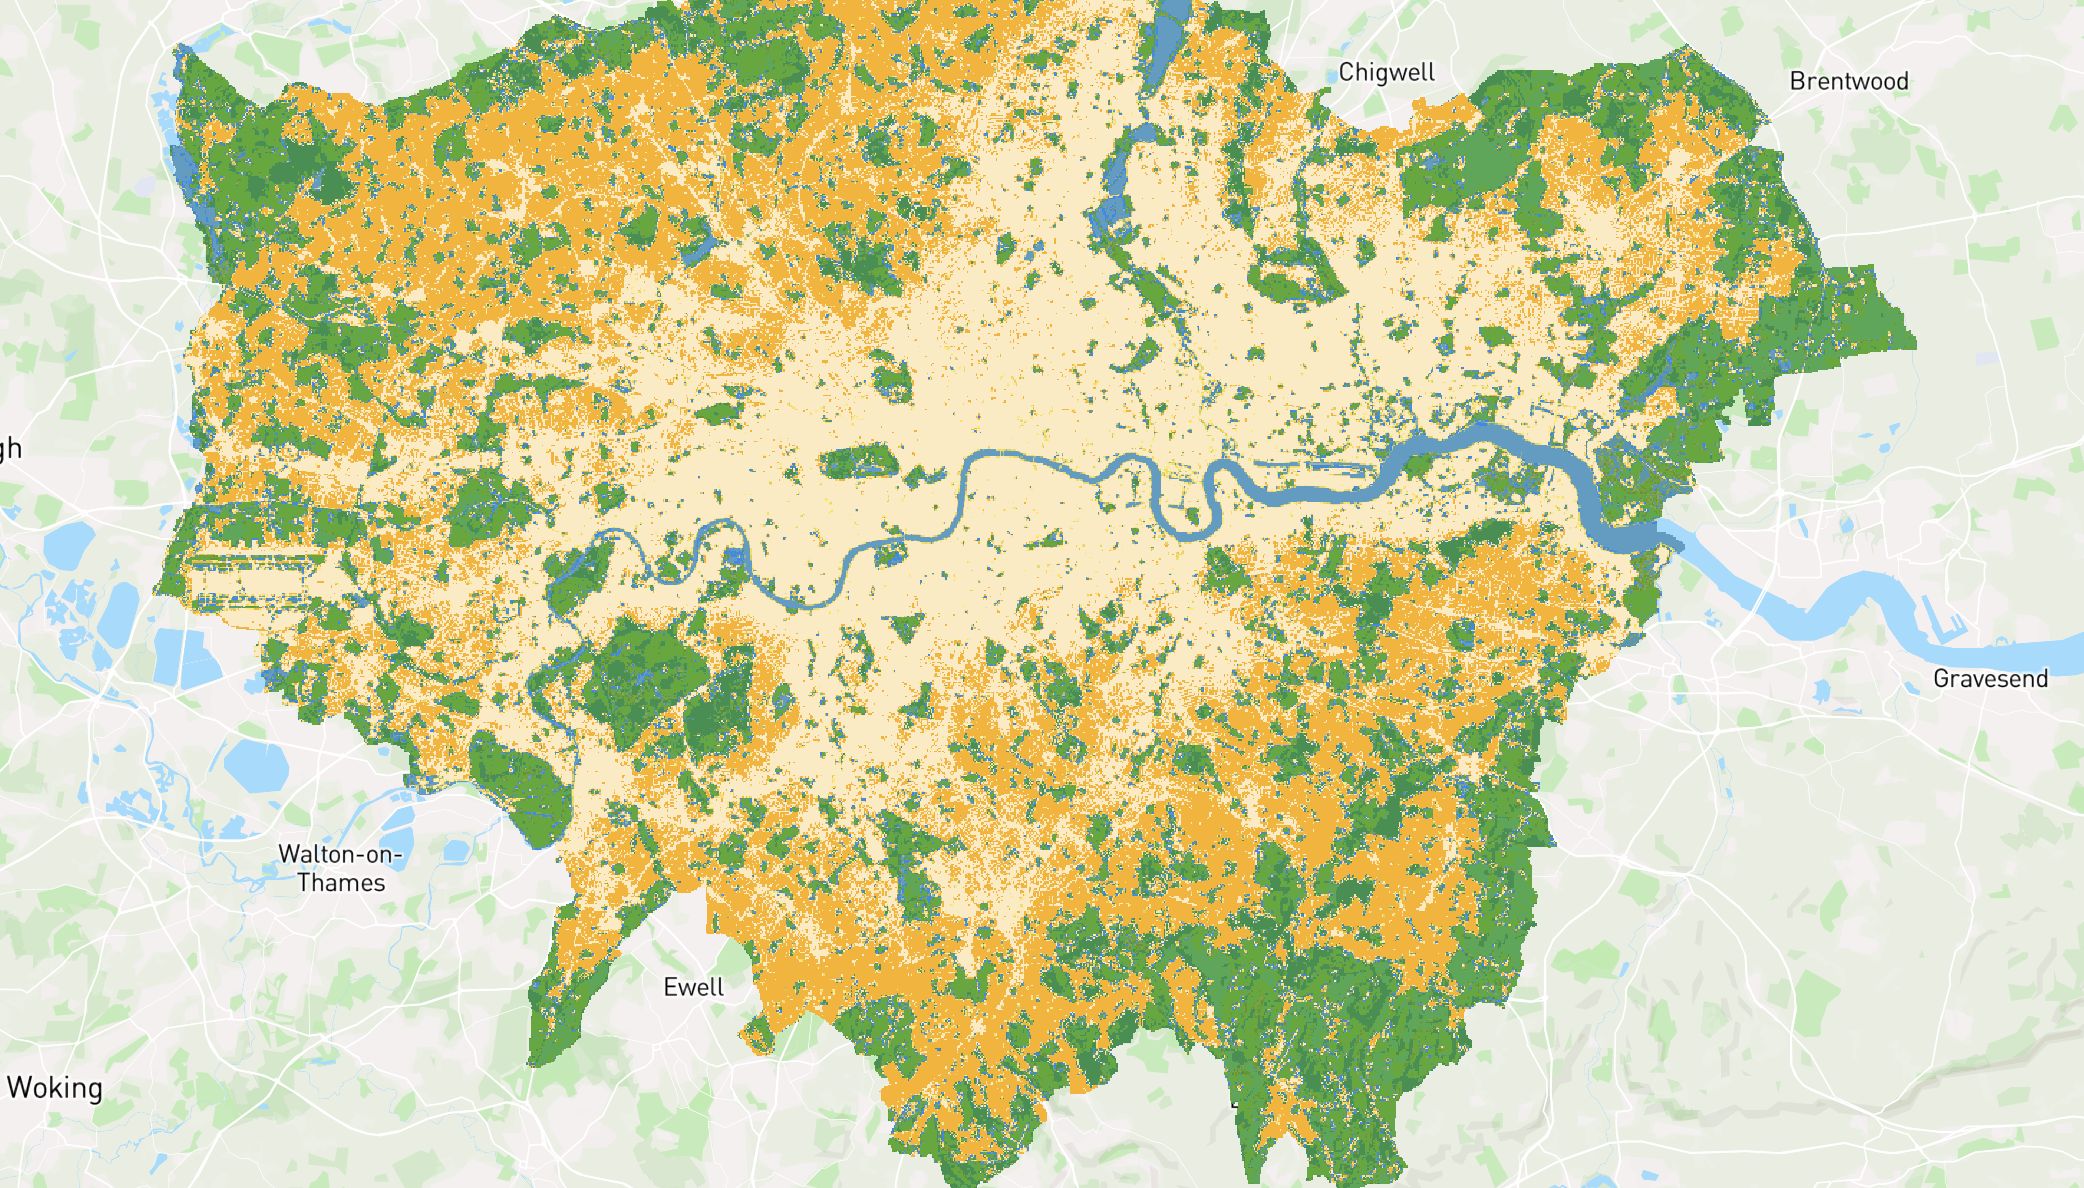
Flexible colorization
Easily upload geo files, spreadsheets, images, and links directly onto the map. Our platform supports all major formats, including .geoJSON, .KML, .shp, and over 30 others, ensuring seamless data integration.
Dynamic styles based on zoom
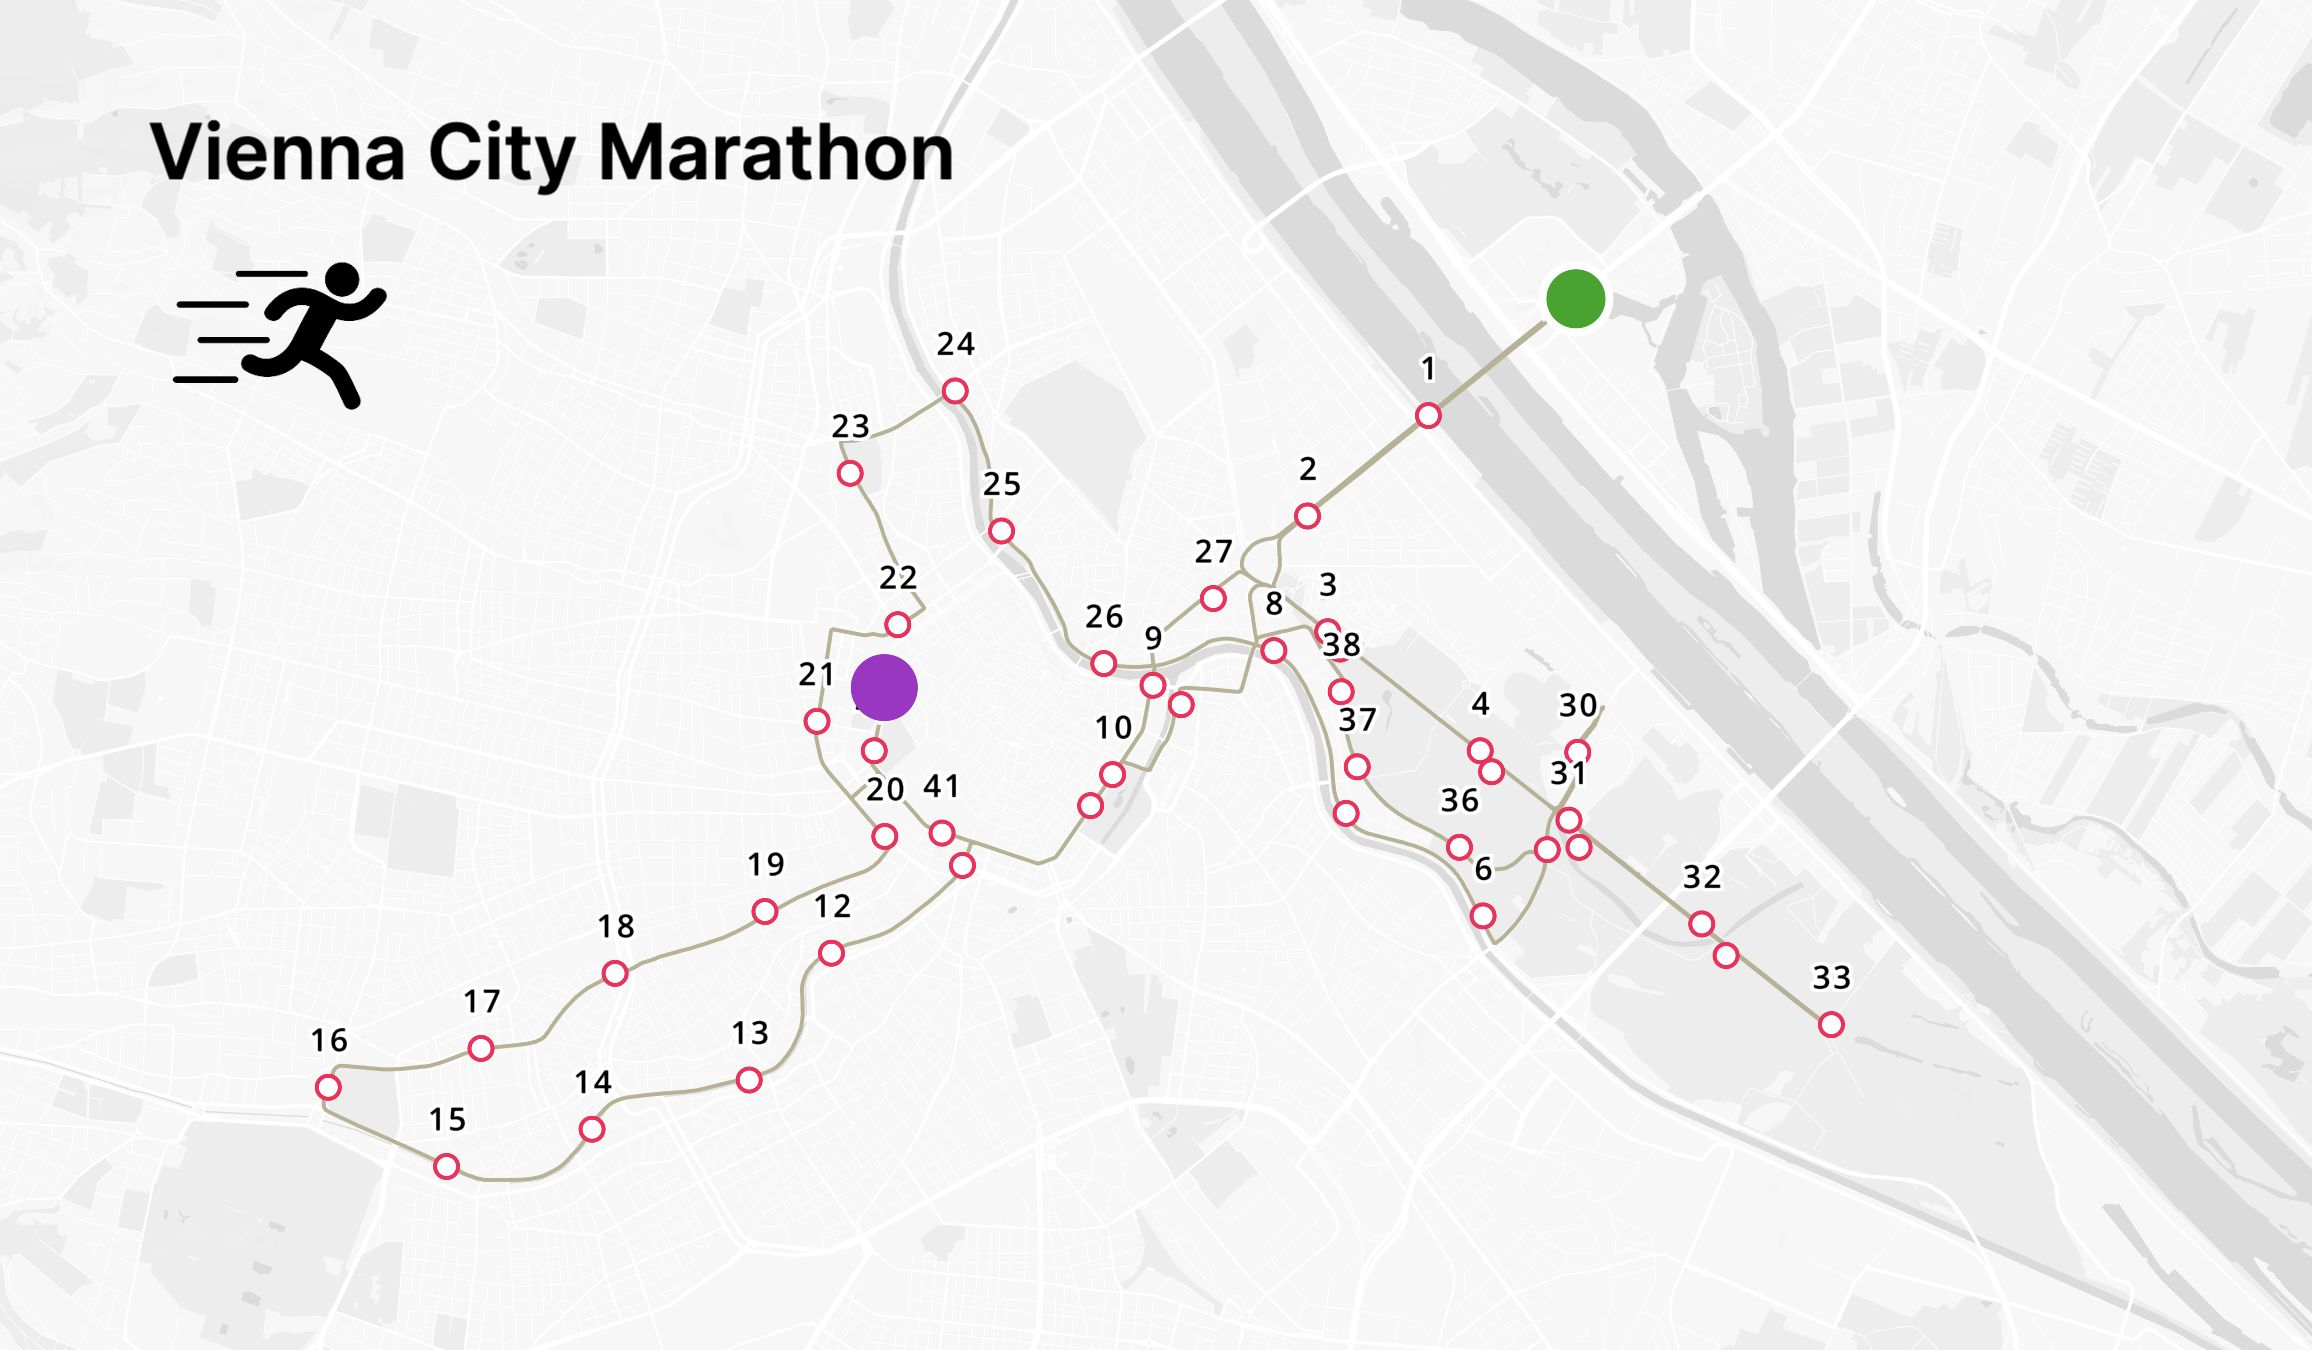
Transform your spatial data into insightful visualizations with our powerful styling tools.
Customize colors, symbols, and labels to highlight key patterns and trends. Create dynamic, interactive maps that bring your data to life, making complex information easy to understand and share.
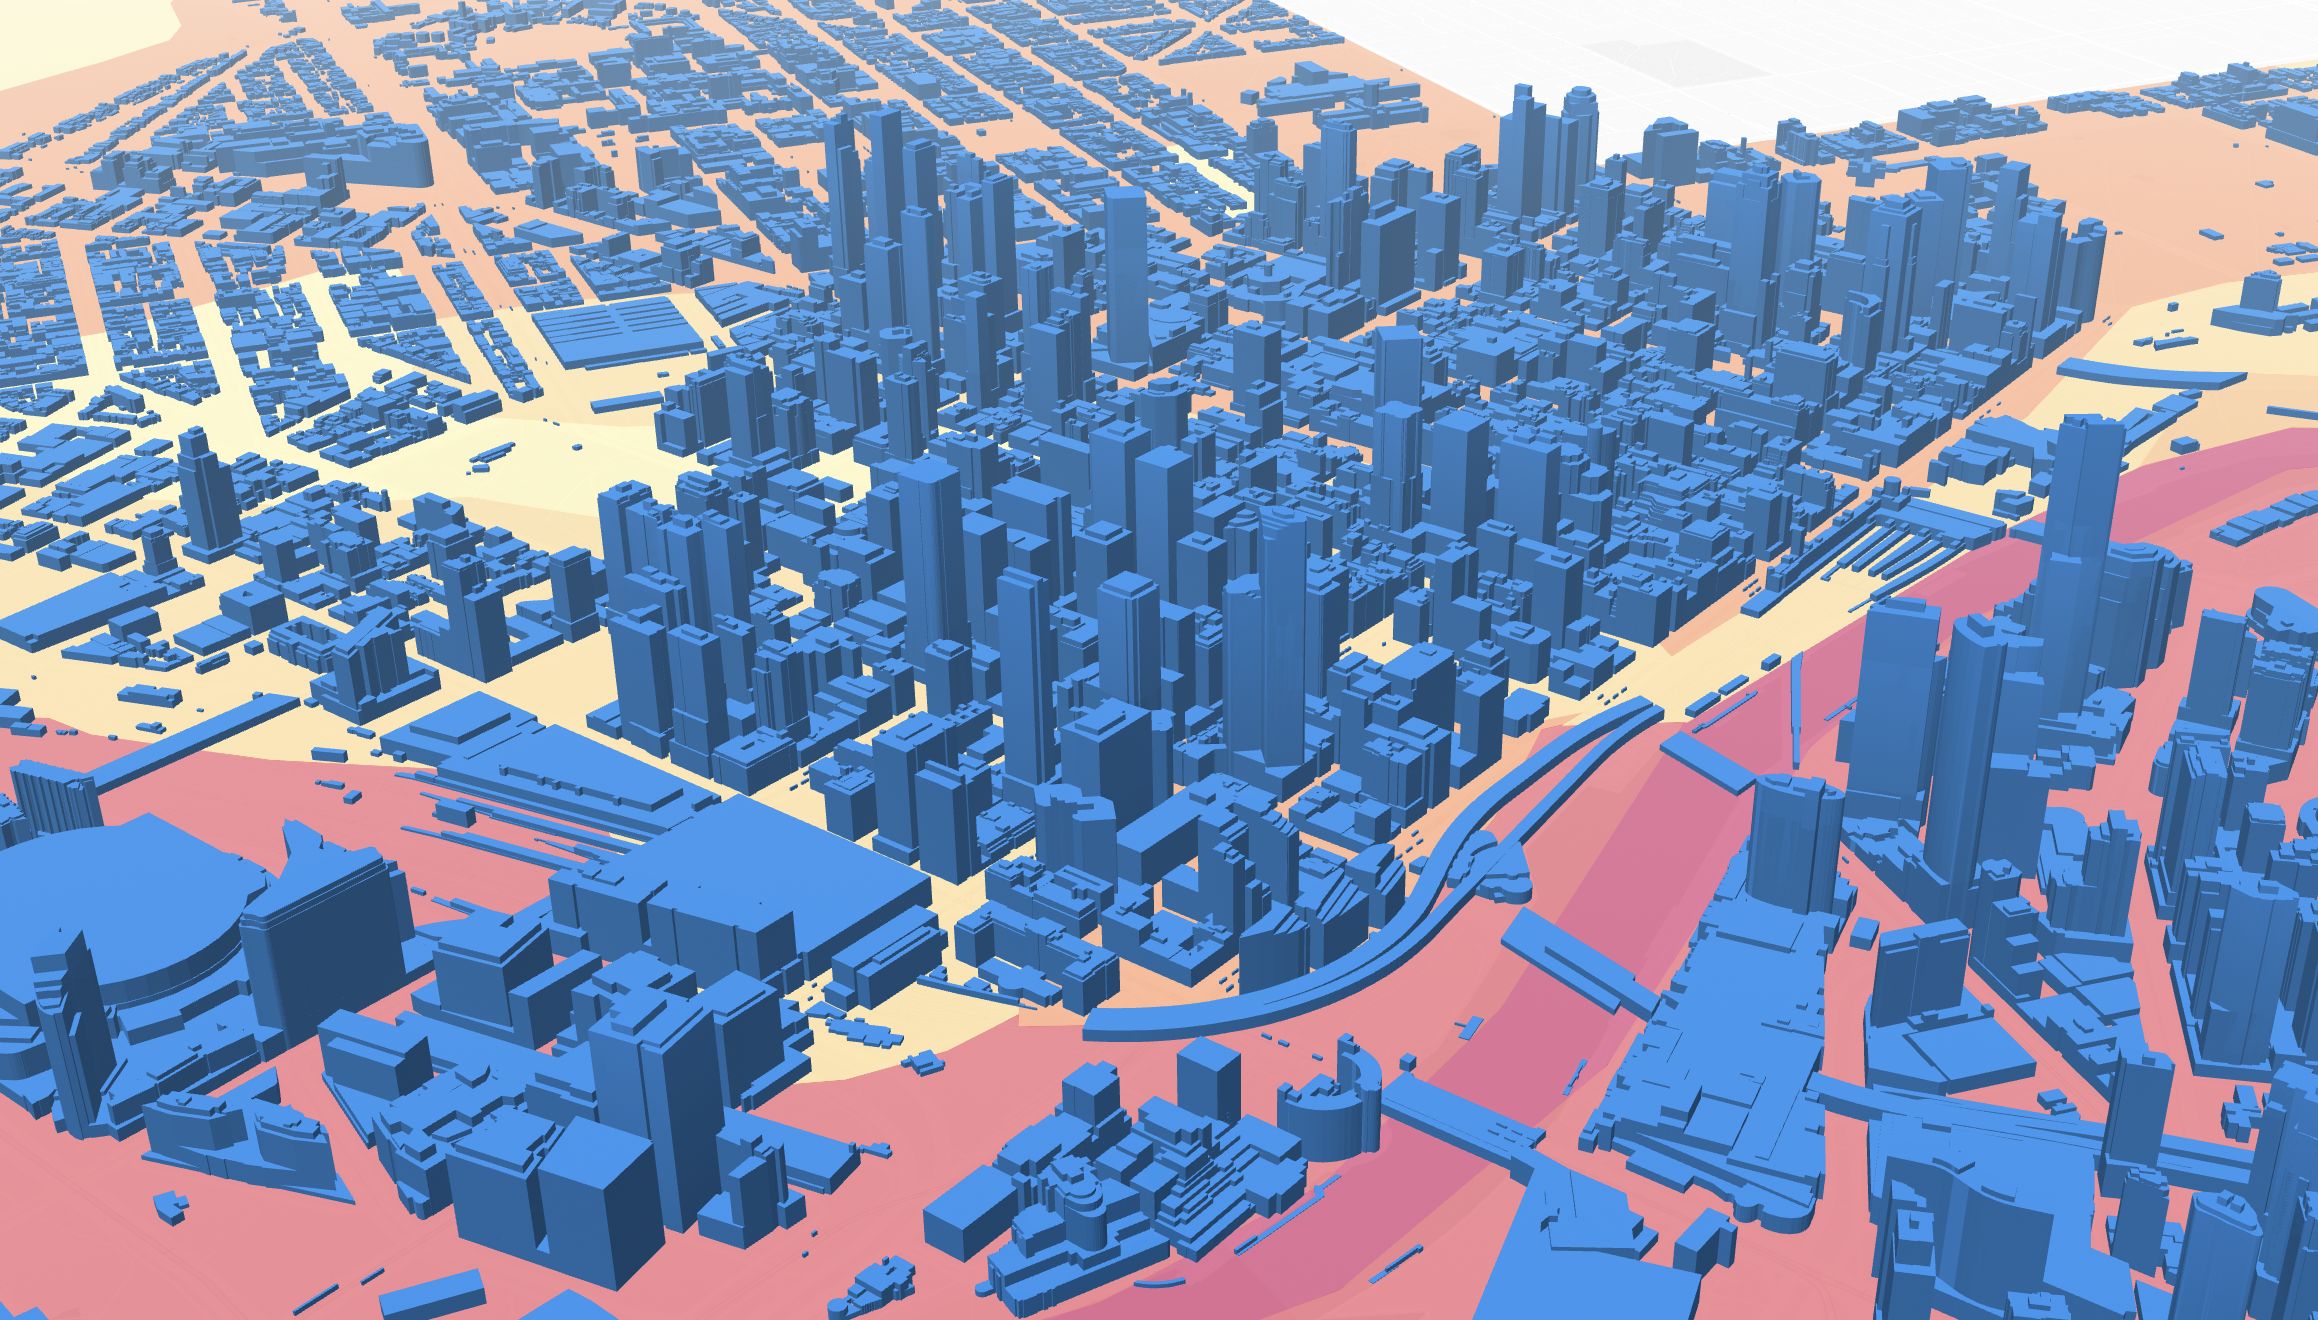
Immersive 3D visualization
Unlock deeper insights with our advanced spatial analysis tools.
Conduct proximity searches, overlay analysis, and data aggregation to reveal hidden patterns and relationships. Easily perform buffer, intersection, and density analyses to support your decision-making processes.
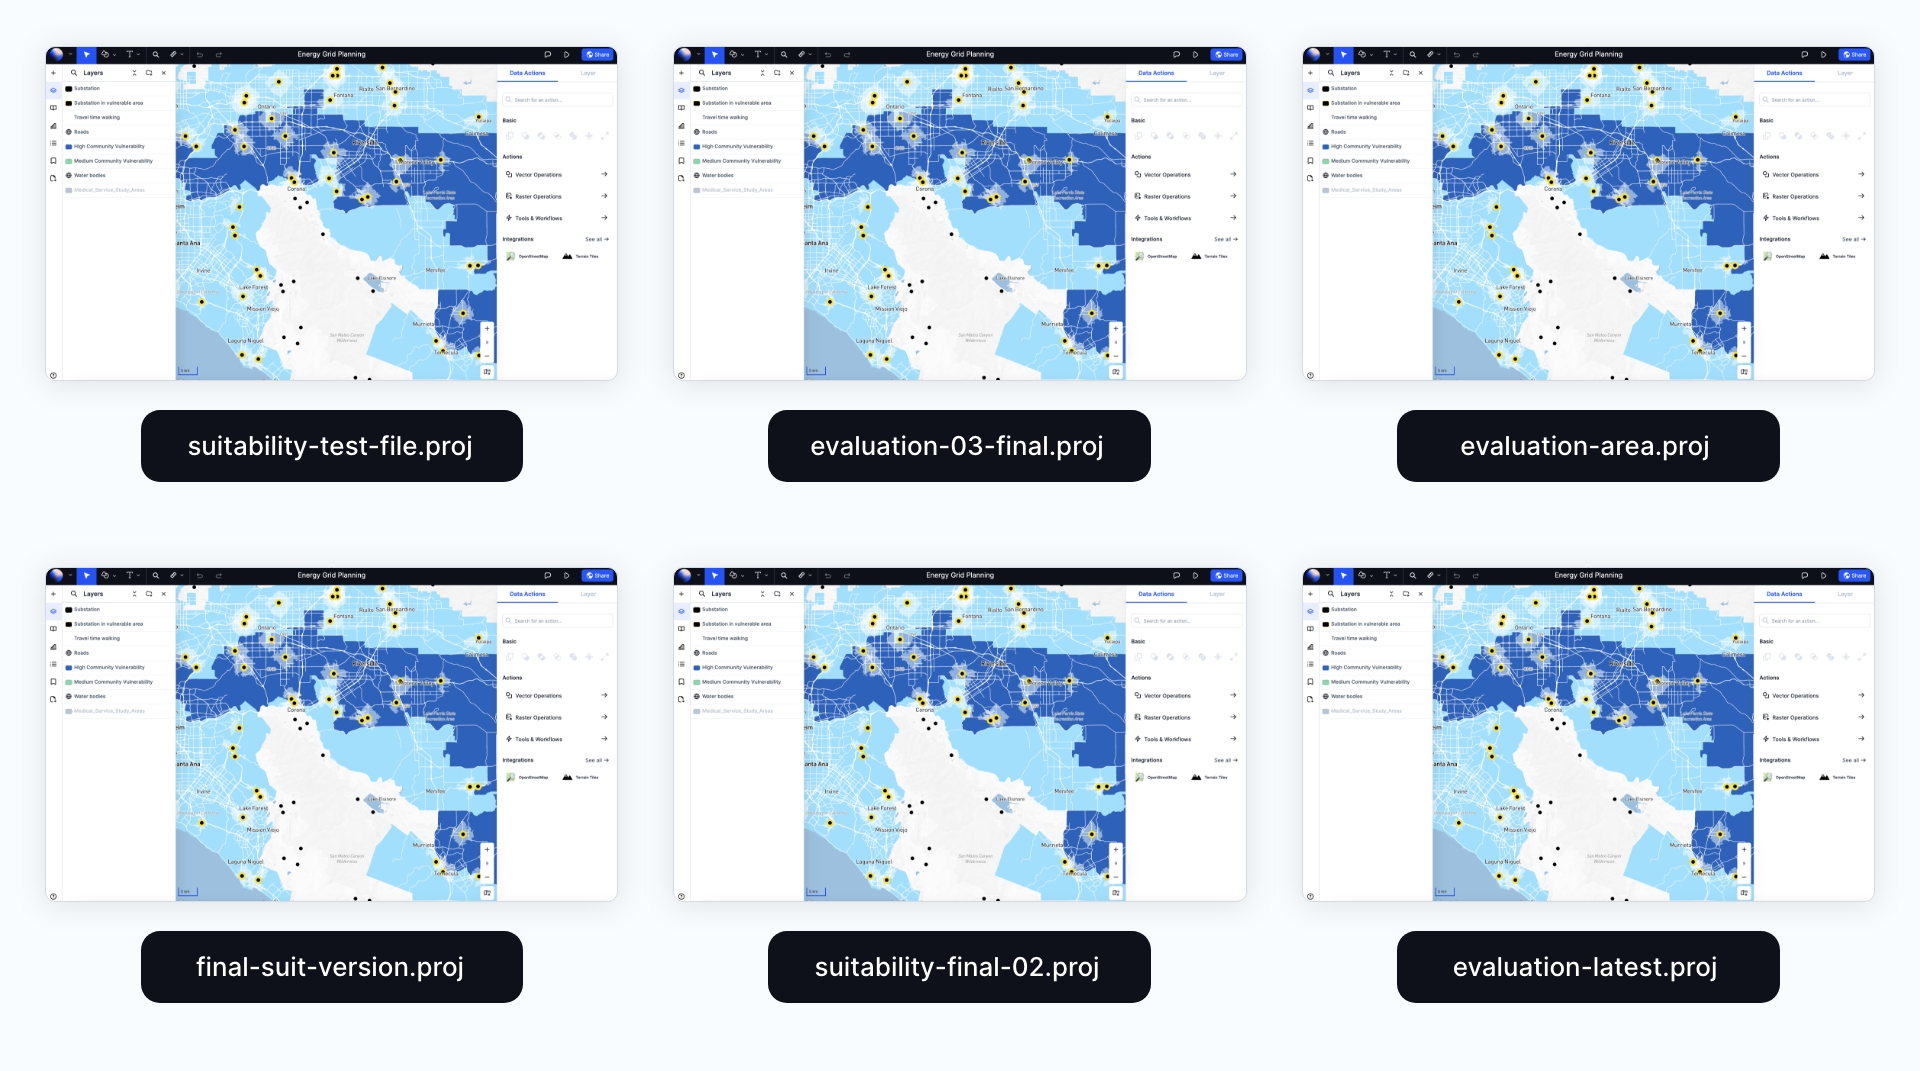
Designed to be easily updated
Web maps are live assets designed to be edited, and any changes will be automatically updated synced across all members.