Build interactive dashboards
Visualize millions of data points with ease. Create and share interactive dashboards that take your data storytelling to the next level.
Enable a richer interaction with your data
Create interactive dashboards that allow users to explore data in a more engaging way. Our widgets are designed to be easy to use and highly customizable.
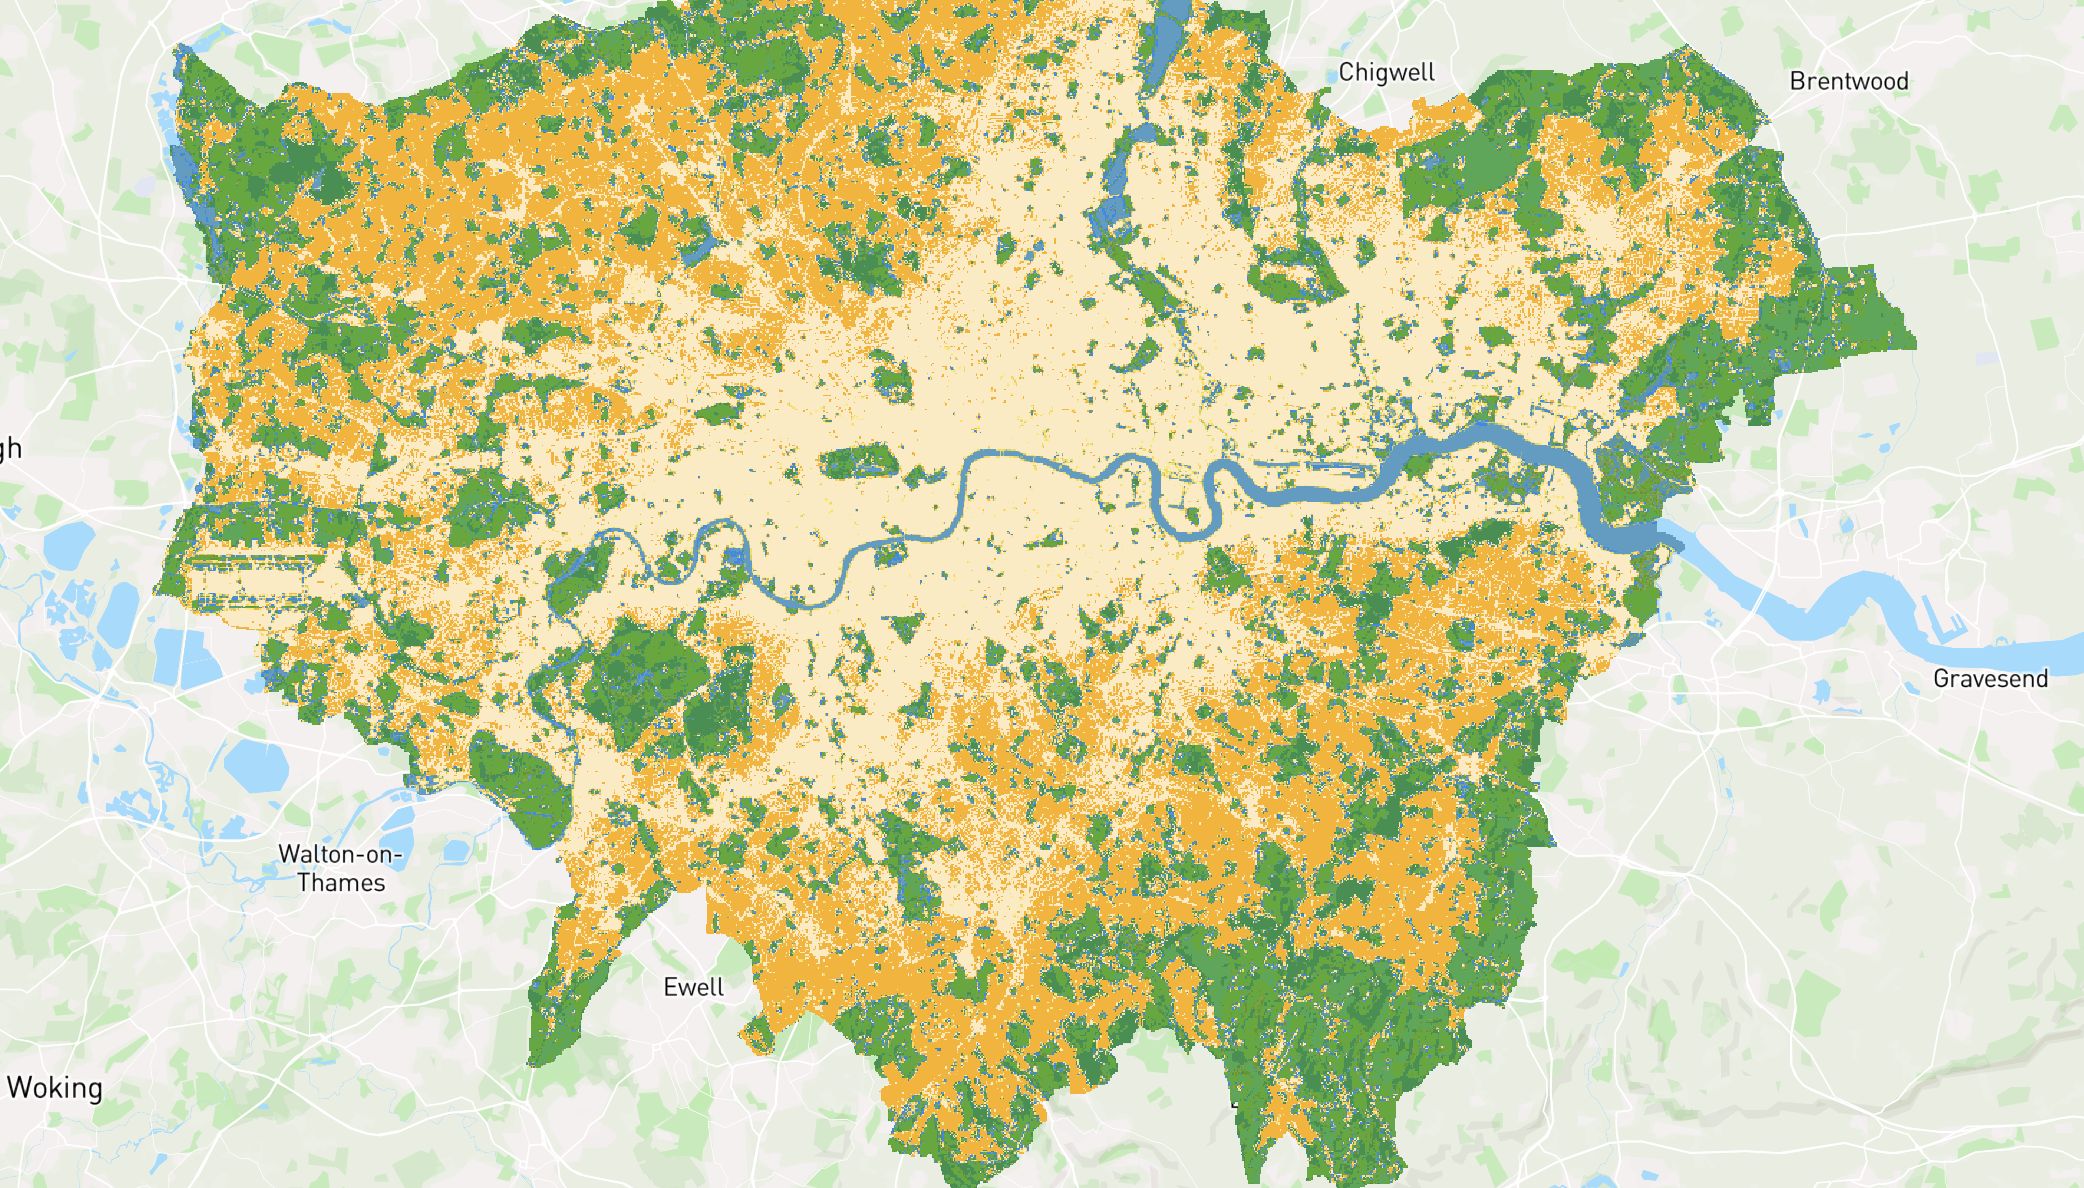
Summarize and compare categorical data
The Category widget summarize and compare categorical data using proportional bar lengths to represent values. The longer the horizontal bar, the greater the value it represents.
Use this widget to compare the distribution of data across a set of categories. It is particularly useful for comparing the size of a category to the total.
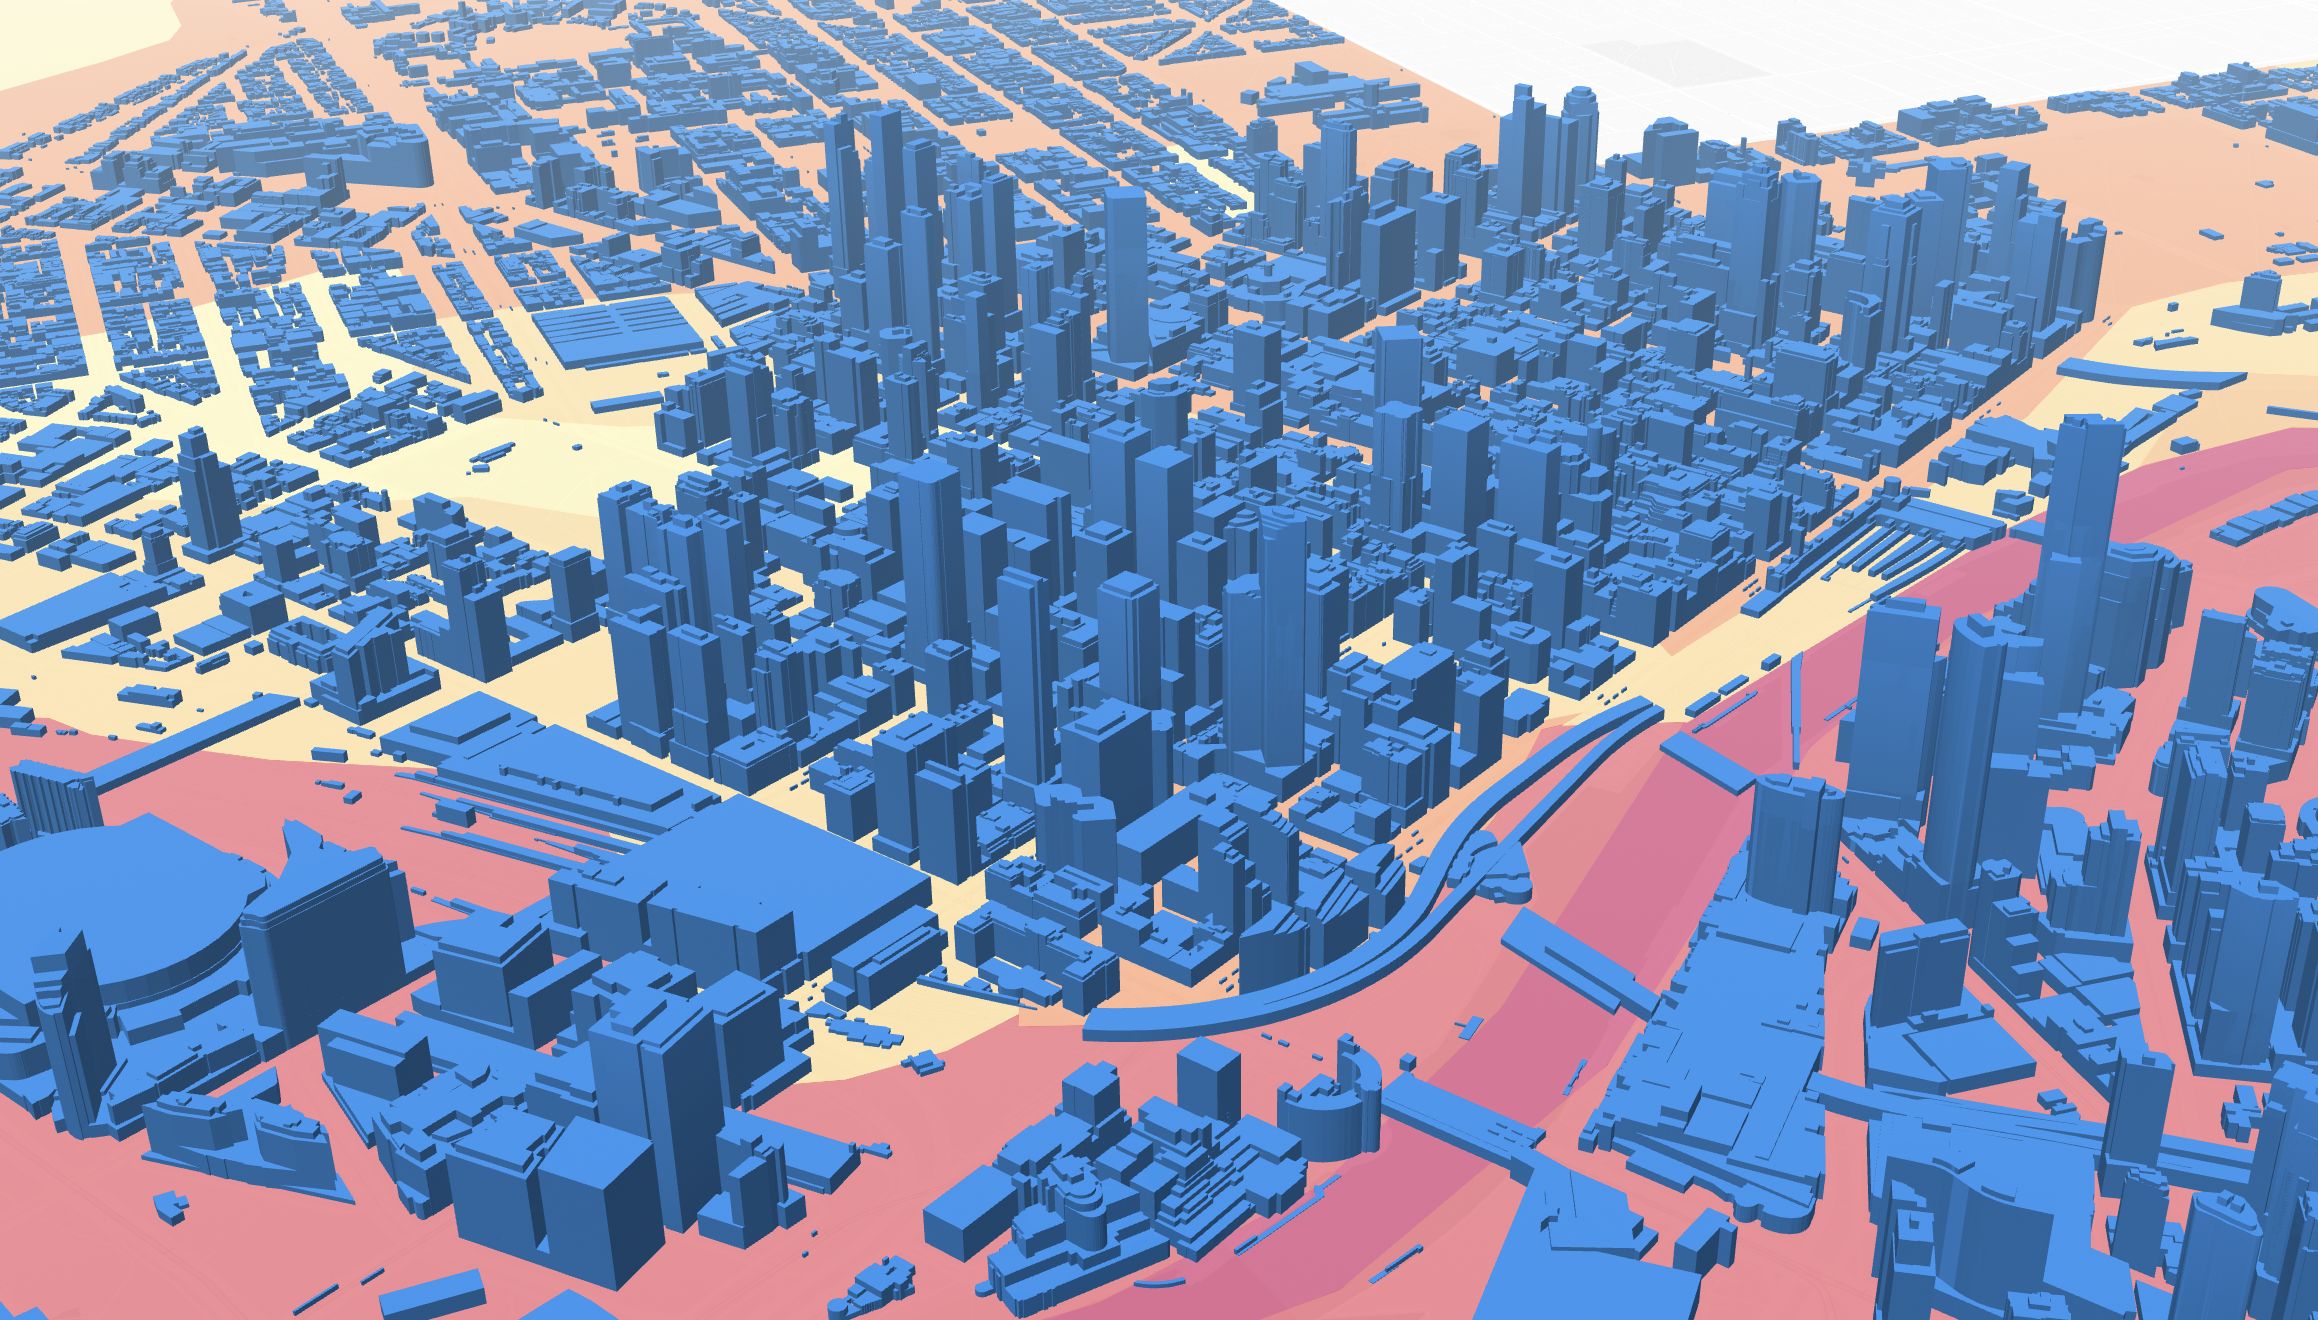
Dynamic data filtering
The Range widget allows you to filter data based on a specific set of criteria. This is useful when you want to focus on a specific subset of data.
Filter based on viewport bounds, numerical ranges, or any other data in your dataset.
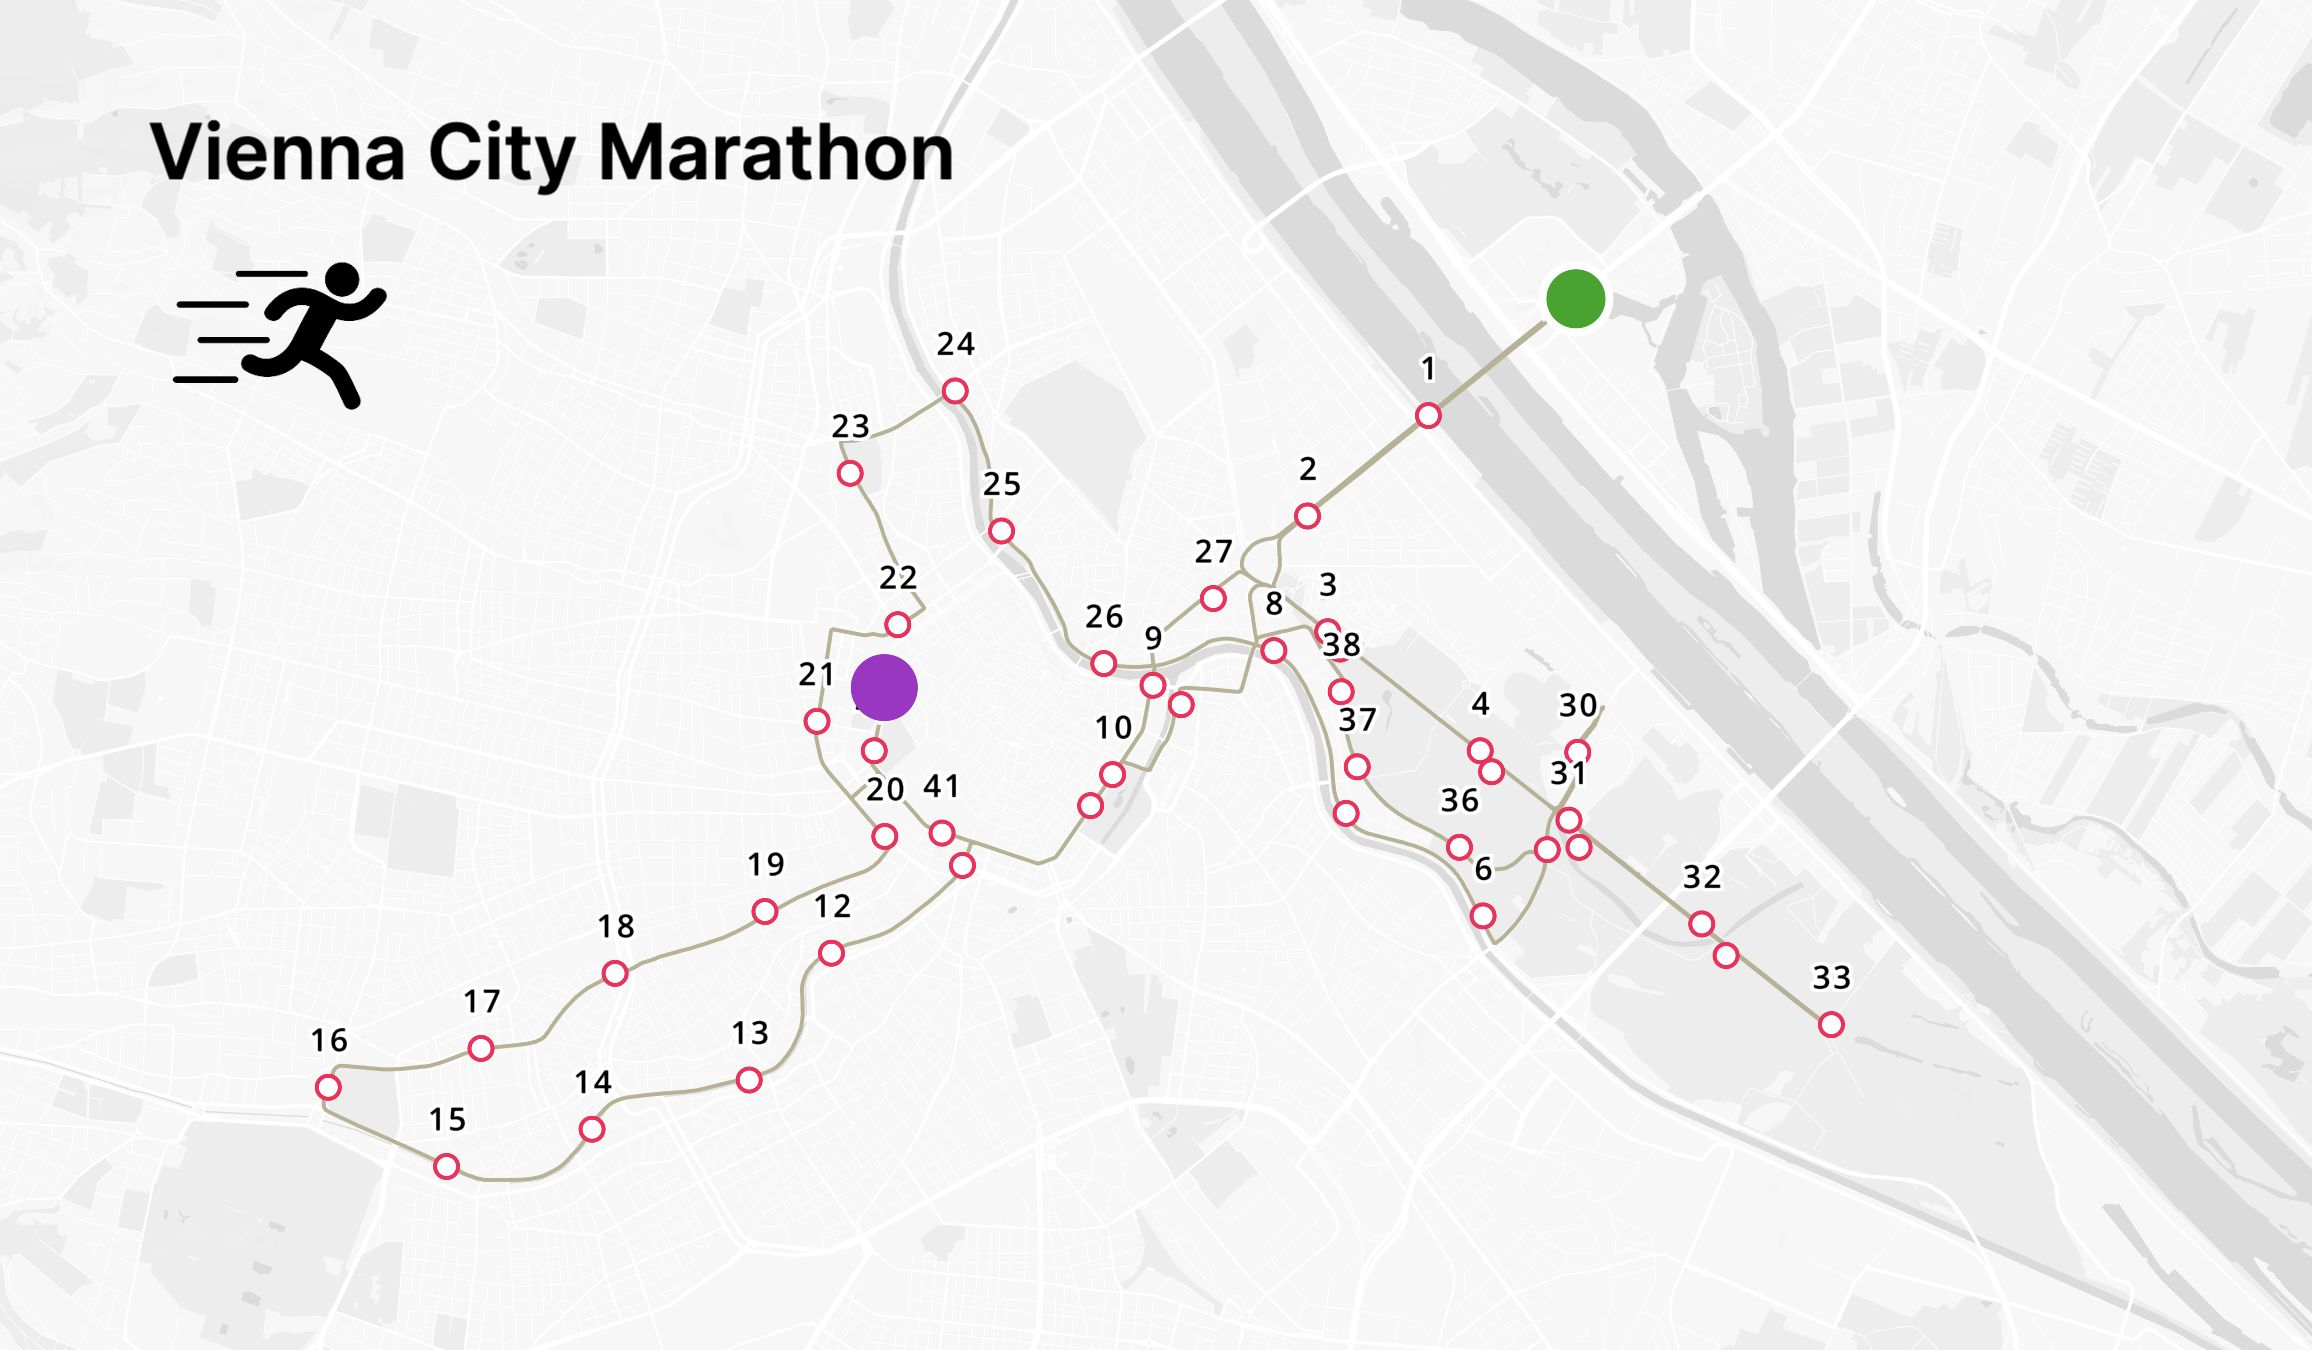
Identify patterns over time
The Time Series widget allows you to visualize data over time, and is particularly useful for identifying trends and patterns.
Use this widget to compare data points over time, and to identify relationships between variables. It is particularly useful for time series data.
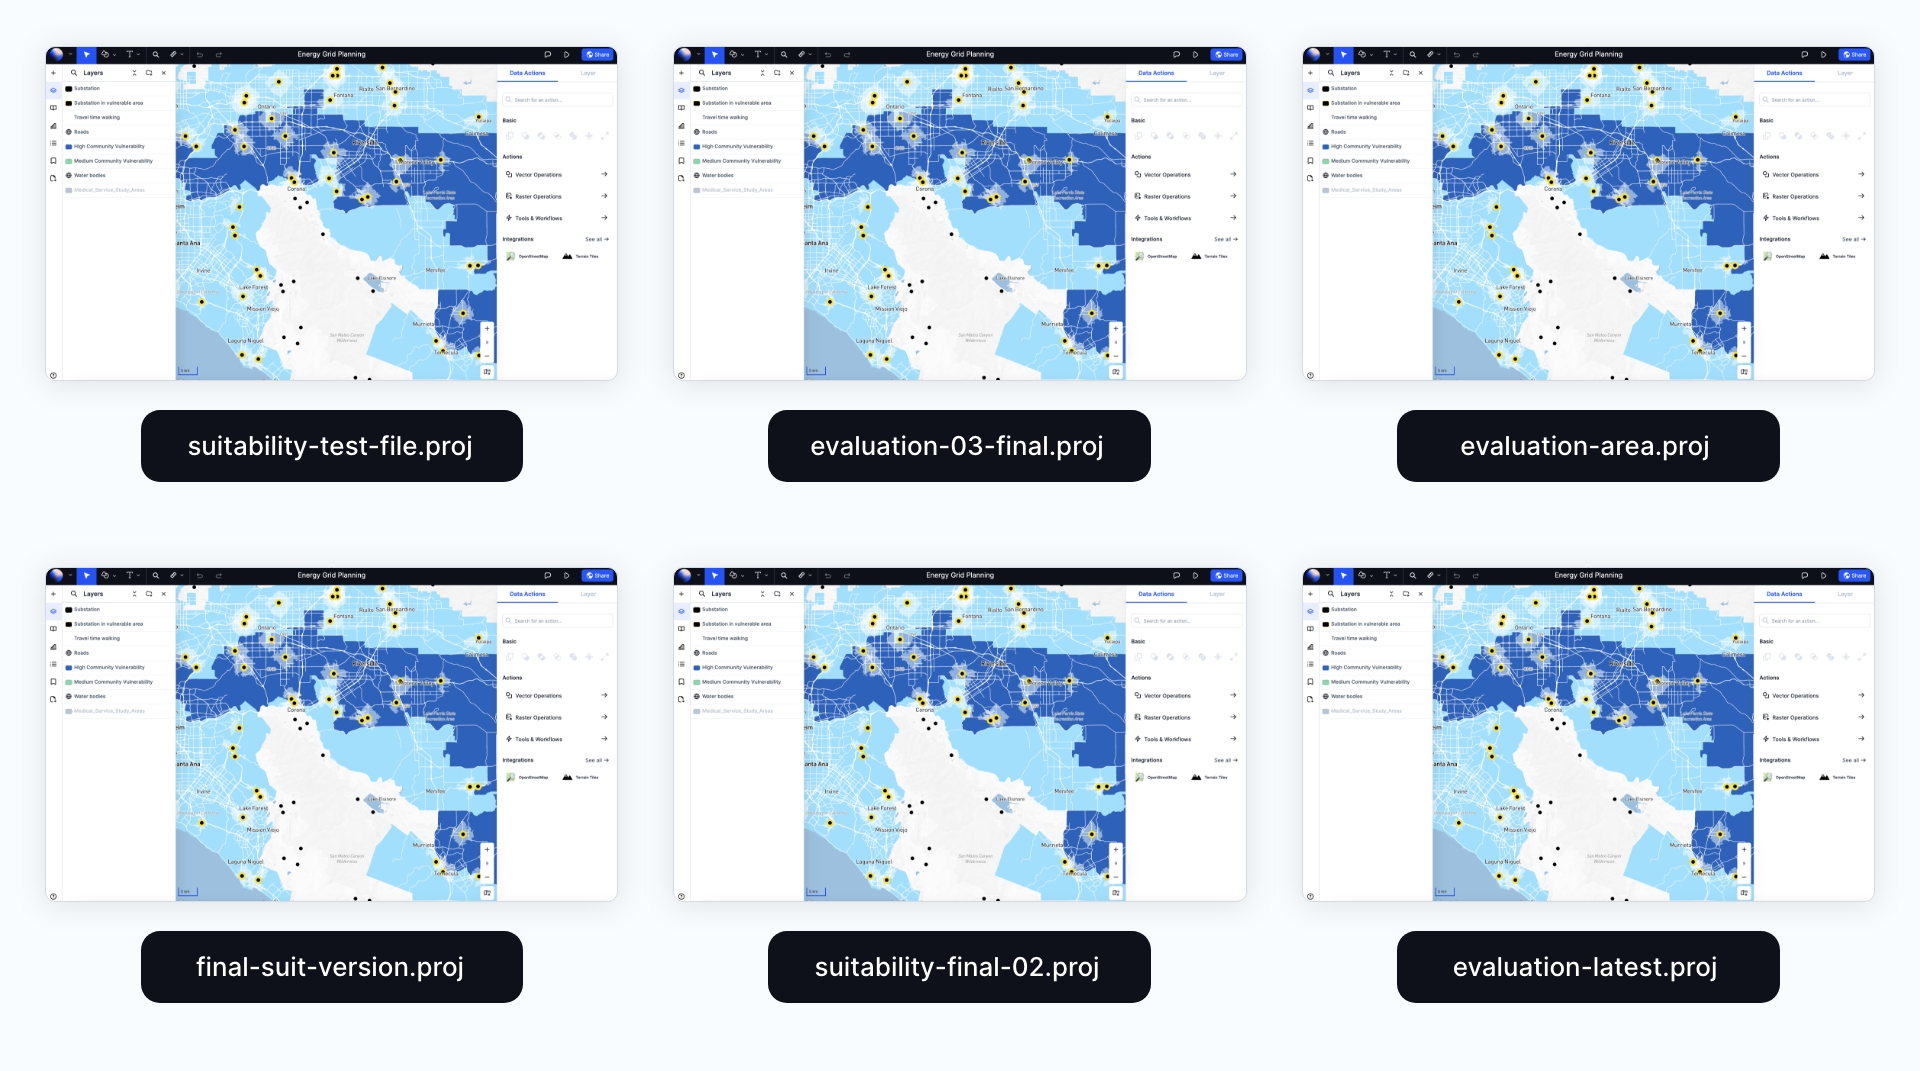
Designed to be easily updated
Web maps are live assets designed to be edited, and any changes will be automatically updated synced across all members.