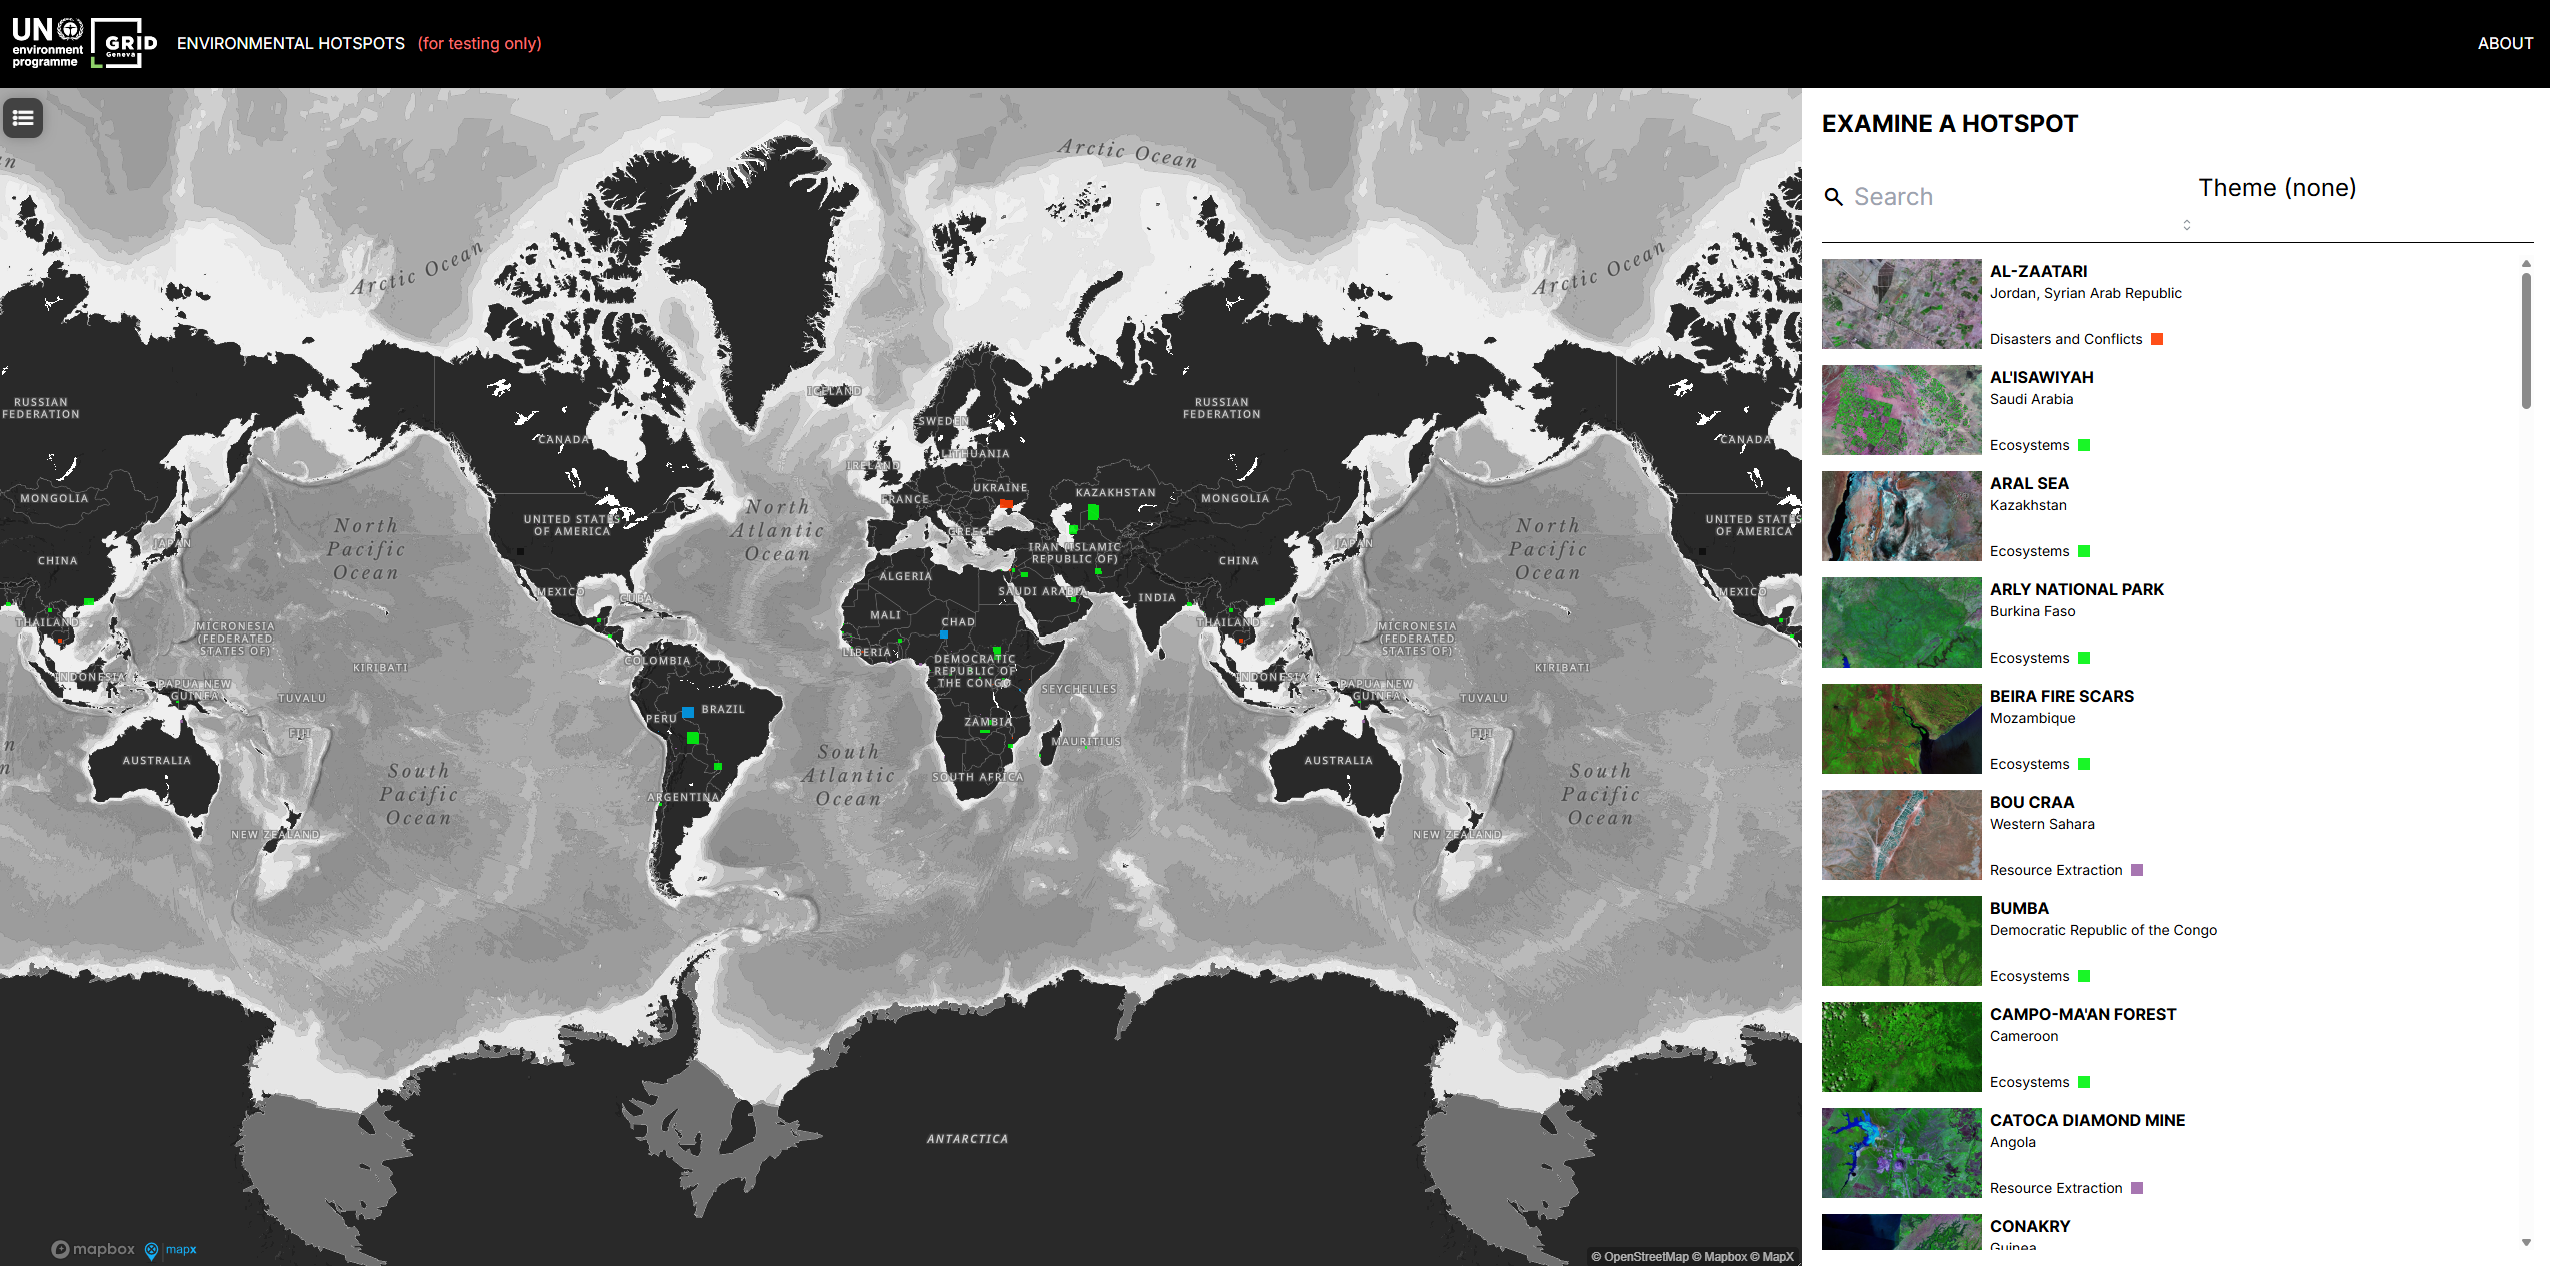
Environmental Hotspots is a comprehensive platform developed by UNEP that uses satellite imagery to showcase and analyze critical environmental locations worldwide.
The platform provides detailed visual documentation of environmental changes, covering ecosystems under threat, climate change impacts, resource extraction sites, urban development, and areas affected by disasters and conflicts.
Key Features
- Satellite Imagery Analysis: High-quality satellite images showing environmental changes over time
- Global Coverage: Environmental hotspots from every continent and region
- Thematic Organization: Sites categorized by environmental themes and impact types
- Before/After Comparisons: Visual documentation of environmental changes
- Detailed Site Profiles: Comprehensive information for each hotspot location
- Search and Filter: Easy navigation by location, theme, or environmental impact
Environmental Themes
- Ecosystems: Forest loss, wetland degradation, biodiversity hotspots, and protected areas
- Climate Change and Atmosphere: Glacier retreat, sea level impacts, and atmospheric changes
- Resource Extraction: Mining sites, oil fields, and industrial extraction impacts
- Urbanization: City expansion, coastal development, and urban sprawl
- Disasters and Conflicts: Areas affected by natural disasters, conflicts, and refugee situations
Notable Hotspots
- Aral Sea (Kazakhstan): Dramatic shrinkage of one of the world's largest lakes
- Lake Chad (Chad): Climate-driven lake shrinkage affecting millions
- Mount Kilimanjaro (Tanzania): Glacier retreat due to climate change
- Rondônia (Brazil): Deforestation in the Amazon rainforest
- Dubai Coastline (UAE): Massive coastal development and land reclamation
- Niger Delta (Nigeria): Oil extraction impacts on ecosystems
- Gaza: Environmental impacts of conflict and urban pressure
Applications
- Environmental Education: Visual learning about global environmental challenges
- Research Support: Satellite data for environmental and climate research
- Policy Advocacy: Evidence for environmental protection and climate action
- Monitoring and Assessment: Track environmental changes over time
- Public Awareness: Communicate environmental issues to broad audiences
- Conservation Planning: Identify priority areas for environmental protection
Use Cases
- Educators and Students: Classroom teaching about environmental issues
- Environmental Organizations: Advocacy and awareness campaigns
- Researchers: Visual data for environmental impact studies
- Journalists: Evidence and imagery for environmental reporting
- Policy Makers: Understanding environmental challenges for decision-making
- Conservation Groups: Identifying areas needing protection or restoration
Environmental Hotspots provides powerful visual evidence of how human activities and climate change are transforming our planet, making complex environmental issues accessible and understandable to diverse audiences. 2. Explore available features and data layers 3. Select your area of interest for analysis 4. Access relevant data for your specific needs 5. Export or integrate results into your workflow
Use Cases
- Climate risk assessment for businesses and organizations
- Environmental impact evaluation for projects
- Research and analysis for academic and scientific purposes
- Policy development and regulatory compliance
- Educational and training applications
Environmental Hotspots provides essential capabilities for understanding and addressing climate and nature-related challenges in today's changing world.