Data Sources/ACLED — Armed Conflict Location & Event Data

ACLED — Armed Conflict Location & Event Data

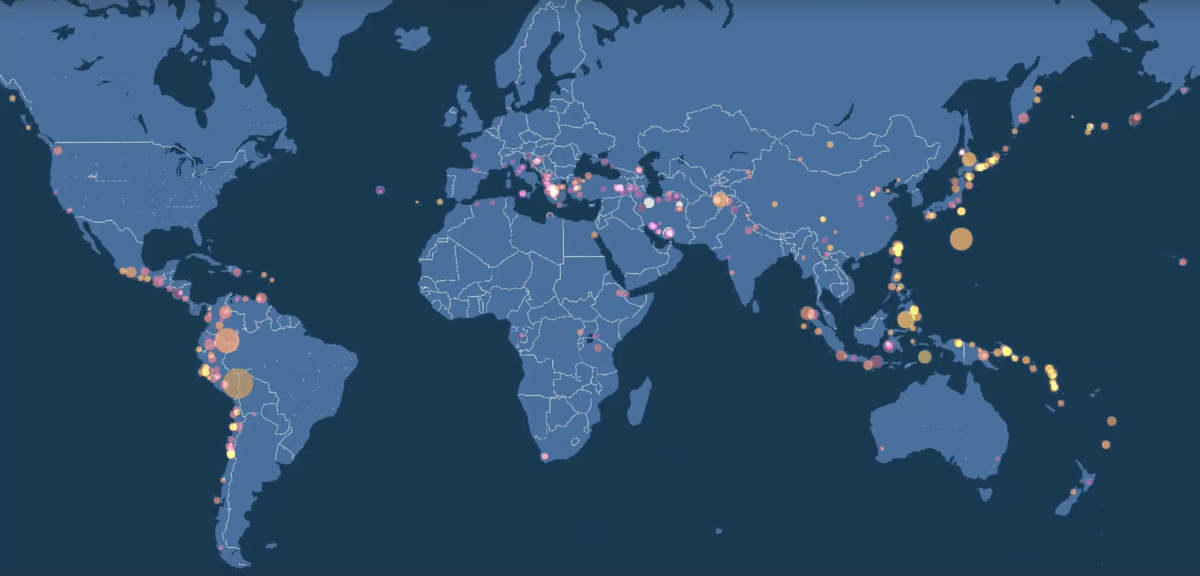
ACLED (Armed Conflict Location & Event Data Project) provides free real-time data on political violence, conflict events, and protests globally. Used by researchers, NGOs, governments, and journalists to track and analyze conflict patterns with precise location and date information.

Humanitarian Aid

Coordinate disaster relief, refugee support, and development programs using population and crisis data.

Disaster Response

Support rapid disaster assessment, emergency management, and recovery efforts with real-time and historical hazard data.

ACLED — Armed Conflict Location & Event Data

ACLED (Armed Conflict Location & Event Data Project) is the global standard for disaggregated conflict data — the dataset that researchers, journalists, and humanitarian organizations reach for when they need to know not just that a conflict is happening, but precisely where, when, and what type of violence is occurring.

Unlike aggregate conflict datasets that count "conflicts per country," ACLED records individual events: a battle on a specific date at specific coordinates, a protest in a named town, an explosion at a reported location. Each record captures the actors involved, estimated fatalities, and a narrative note describing the event. This granularity enables analysis that country-level conflict indicators cannot support.

The coverage is genuinely global. ACLED monitors countries across Africa, the Middle East, South Asia, Southeast Asia, Latin America, and increasingly Europe and North America, with weekly updates adding new events within days of their occurrence. The dataset currently holds tens of millions of events across more than 230 countries and territories.

For GIS analysis, ACLED data arrives as georeferenced point events that can be mapped directly, aggregated to administrative boundaries, or analyzed using density and clustering methods. Conflict hotspot identification, correlation analysis with displacement data, and temporal trend analysis are common applications. Organizations including UNHCR, OCHA, and the International Crisis Group use ACLED data to support operational decision-making in humanitarian response.

A key use case is early warning: because ACLED tracks protest and civil unrest events alongside armed conflict, the data provides leading indicators of escalation before violence intensifies. Several early warning systems combine ACLED event data with economic, political, and social variables to model conflict risk.

Access requires free registration at acleddata.com. The API provides programmatic access for automated updates, and bulk downloads are available in CSV and Excel formats with full documentation of the coding methodology.


Frequently Asked Questions

Battles, explosions/remote violence, violence against civilians, protests, riots, and strategic developments. Each event includes date, location (with coordinates), actors involved, fatalities, and event notes.

Yes for non-commercial use. Researchers, journalists, NGOs, and governments can access ACLED data for free with a registered account. Commercial licensing is available separately.

ACLED updates weekly. Researchers review and code events within approximately 1 week of occurrence, providing near-real-time conflict tracking at global scale.

Events are geocoded to the location level (village, town, neighborhood) where possible, with coordinates. Precision flags indicate confidence in the location. Coverage spans all countries globally since varying start dates.

Academic conflict research, humanitarian aid planning, media reporting, government security assessments, early warning systems, peacekeeping planning, and NGO program design in conflict-affected areas.

Details

CoverageGlobal
Layer TypeVector (point events)
Update FrequencyWeekly
Categories
ConflictHumanitarianReal-time
Visit sourceUse data in Atlas

Discover more data sources

EOS Data Analytics

EOS Data Analytics provides high-resolution satellite imagery, AI-driven remote sensing tools, and real-time environmental monitoring.

Biodiversity, Remote Sensing

OpenStreetMap

OpenStreetMap (OSM) is one of the best free and open-source geospatial data sources. With constantly updated roads, buildings, and land use data, OSM is perfect for GIS, urban planning, navigation, and research. It offers global coverage, multiple formats, and developer-friendly APIs. Whether you need offline maps, real-time updates, or detailed geographic features, OSM is an essential tool for spatial analysis.

Mapping

Ministerio de Transportes

Explore GIS data sources from the Ministries of Transport in Spain, Colombia, and Peru. Access transportation networks, infrastructure, and mobility data for planning and analysis.

Demographic

WorldClim

WorldClim provides free, high-resolution climate data, including temperature, precipitation, and future climate projections.

Climate

FAO GeoNetwork

FAO GeoNetwork provides free, high-quality geospatial data for agriculture, food security, land use, and climate research. With global datasets, interactive maps, and GIS-ready formats, it's an essential tool for researchers, policymakers, and sustainability experts.

Biodiversity, Climate

Opendatasoft

Opendatasoft is a platform hosting thousands of public GIS datasets from cities, agencies, and companies.

Demographic

OpenTopography

OpenTopography provides free, high-resolution elevation and LiDAR data for GIS, remote sensing, and environmental analysis.

Elevation

NOAA

Weather, climate, ocean, and atmospheric datasets from the U.S. National Oceanic and Atmospheric Administration.

Climate, Remote Sensing