Climate Impact Explorer is a science-based visualization tool developed by Climate Analytics that shows how climate change impacts will evolve over time across countries and provinces at different levels of global warming, providing essential insights for adaptation planning and policy development.
Created in collaboration with the Network for Greening the Financial System (NGFS), Potsdam Institute for Climate Impact Research, and ETH Zürich, this tool transforms complex climate science into accessible visualizations that support evidence-based decision-making for climate resilience.
Whether you're working on climate risk assessment, adaptation planning, financial climate scenarios, or policy development, Climate Impact Explorer provides critical insights into future climate impacts and their spatial and temporal evolution.
1. Comprehensive Climate Impact Projections
Climate Impact Explorer provides detailed impact projections across multiple dimensions:
Geographic Coverage:
- Global, continental, country, and provincial level analysis
- High-resolution spatial mapping capabilities
- Customizable geographic selection and comparison
- Cross-border regional analysis support
Temporal Analysis:
- Time series projections from present to 2100
- Warming level analysis (1.5°C, 2°C, 3°C, 4°C+)
- Emission scenario comparisons
- Decadal and annual temporal resolution
2. Multiple Climate Scenarios
The tool incorporates diverse emission and policy scenarios:
NGFS Scenarios:
- Current policies trajectory (default)
- Net zero 2050 pathways
- Delayed transition scenarios
- Divergent net zero approaches
IPCC Scenarios:
- Representative Concentration Pathways (RCPs)
- Shared Socioeconomic Pathways (SSPs)
- Climate Action Tracker scenarios
- Paris Agreement compatible pathways
3. Wide Range of Impact Indicators
Climate Impact Explorer covers multiple climate impact categories:
Temperature Indicators:
- Mean air temperature changes
- Extreme heat events and heat waves
- Cooling and heating degree days
- Temperature variability and extremes
Precipitation Indicators:
- Mean precipitation changes
- Drought frequency and intensity
- Heavy precipitation events
- Seasonal precipitation patterns
Sectoral Impacts:
- Agricultural productivity and crop yields
- Water availability and stress indicators
- Energy demand projections
- Health impacts from climate change
4. Interactive Visualization Features
The platform offers powerful visualization capabilities:
Time Series Analysis:
- Interactive graphs showing impact evolution
- Scenario comparison overlays
- Uncertainty bands and confidence intervals
- Trend analysis and projection tracking
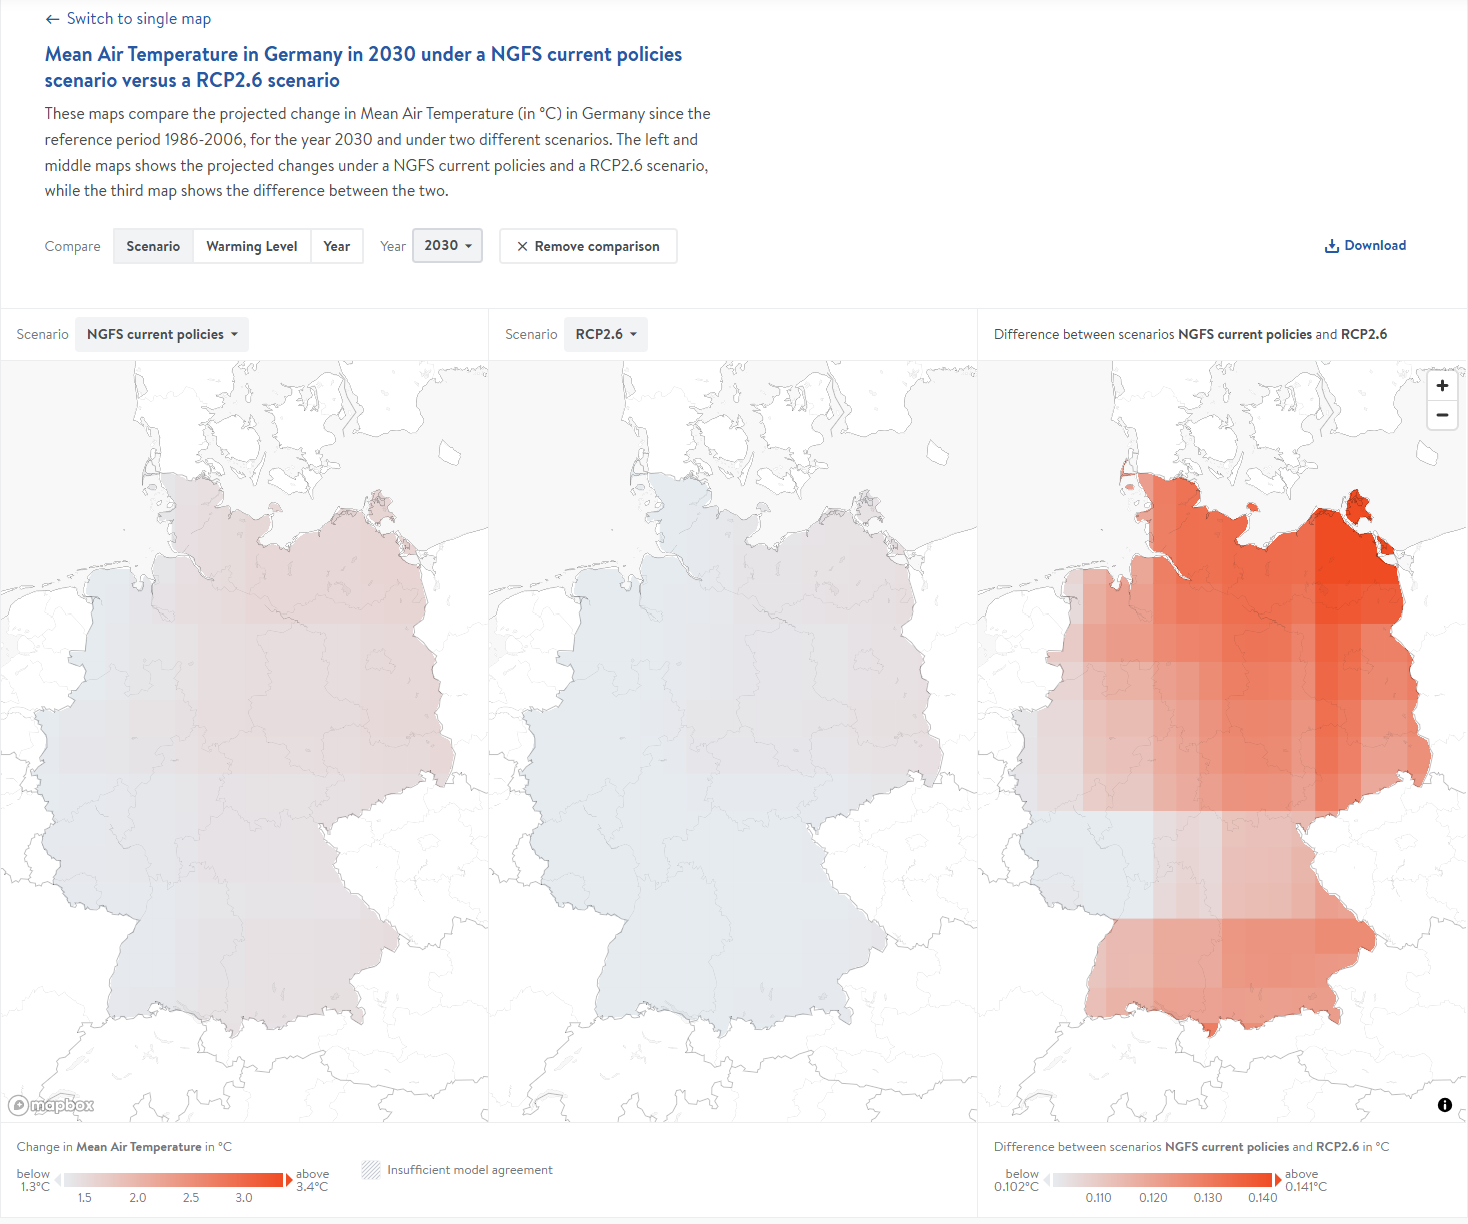
Spatial Mapping:
- Geographic impact distribution maps
- Side-by-side comparisons of different scenarios
- Warming level comparison mapping
- Custom area selection and analysis
Data Export:
- Downloadable data for further analysis
- Multiple formats (CSV, JSON, images)
- API access for automated data retrieval
- Custom report generation
5. Science-Based Methodology
Climate Impact Explorer employs state-of-the-art climate science:
Data Sources:
- CMIP (Coupled Model Intercomparison Project) climate models
- ISIMIP (Inter-Sectoral Impact Model Intercomparison Project) impact models
- Peer-reviewed scientific publications
- Regularly updated datasets and methodologies
Quality Assurance:
- Multi-model ensembles for robust projections
- Uncertainty quantification and communication
- Validation against observations
- Transparent methodology documentation
6. Applications for Decision-Making
The tool supports diverse user communities:
Policy Development:
- National adaptation planning support
- Climate policy impact assessment
- International negotiation evidence
- Sectoral adaptation strategy development
Financial Risk Assessment:
- Climate scenario analysis for TCFD
- Physical risk quantification
- Investment planning under climate change
- Stranded asset assessment
Getting Started with Climate Impact Explorer
- Visit the platform at climate-impact-explorer.climateanalytics.org
- Select a country or region for analysis
- Choose climate impact indicators of interest
- Explore different scenarios and warming levels
- Analyze time series and spatial patterns
- Download data for detailed analysis and reporting
Use Cases
- National Adaptation Planning: Assess climate risks for national adaptation strategies
- Financial Climate Risk: Conduct climate scenario analysis for investment decisions
- Policy Impact Assessment: Evaluate effectiveness of different emission reduction policies
- Sectoral Planning: Plan climate resilience for agriculture, water, energy, and health
- Research Applications: Access climate impact data for scientific studies
- International Cooperation: Support climate negotiations with scientific evidence
Climate Impact Explorer bridges the gap between complex climate science and practical decision-making, empowering users to understand and prepare for climate change impacts across multiple scales and timeframes.