European Drought Observatory (EDO) is a specialized monitoring system operated by the European Commission's Joint Research Centre (JRC) as part of the Copernicus Emergency Management Service. The observatory provides real-time drought monitoring and early warning information across Europe, supporting drought preparedness, response planning, and impact assessment through comprehensive drought indicators and analysis.
The platform delivers up-to-date maps, data, and analysis on drought conditions across European territories, helping governments, emergency managers, and researchers understand and respond to drought events through scientifically-based monitoring tools and indicators.
Key Features
- Real-time drought monitoring with updates every 10 days showing current drought conditions
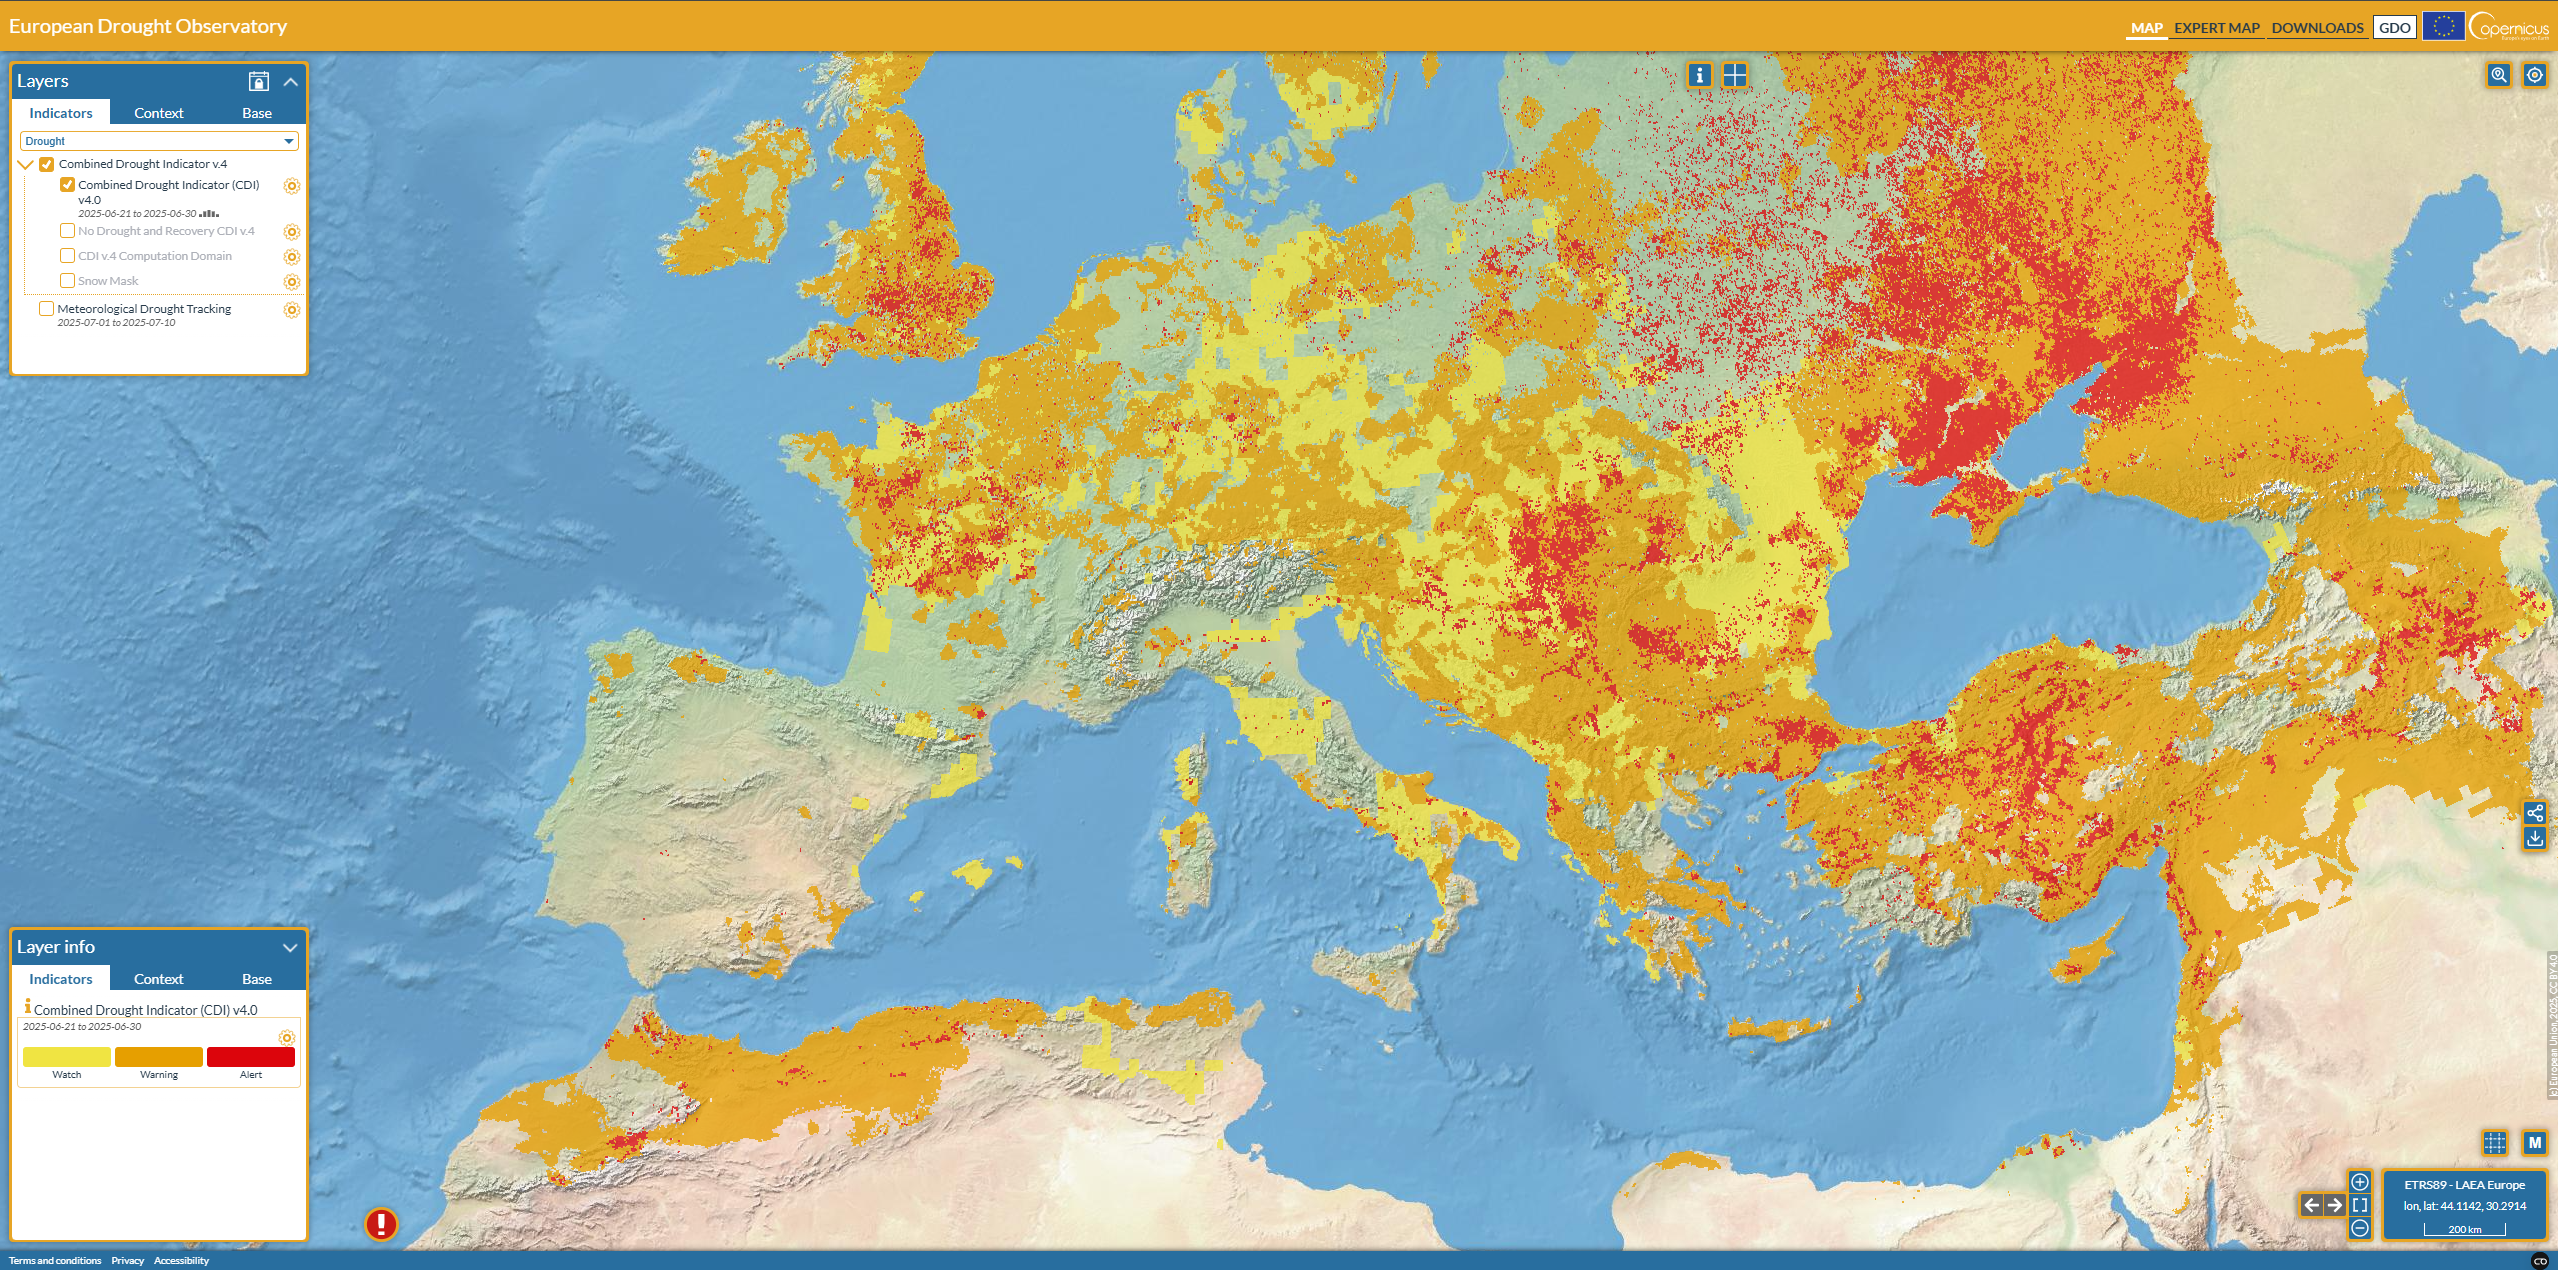
- Combined Drought Indicator (CDI) integrating precipitation, soil moisture, and vegetation data
- Interactive mapping interface with zoom, layer selection, and time series capabilities
- Warning and alert systems categorizing drought severity across European regions
- Historical data access enabling trend analysis and comparison with past drought events
- Mobile-responsive design accessible on tablets, smartphones, and desktop computers
Applications
- Emergency management supporting drought response planning and resource allocation
- Agricultural monitoring tracking drought impacts on crops and farming systems
- Water resource management informing reservoir operations and water supply planning
- Insurance industry providing data for drought risk assessment and claim processing
- Policy development supporting drought adaptation strategies and legislation
- Research and monitoring enabling scientific studies of drought patterns and impacts
Drought Indicators
- Combined Drought Indicator (CDI) showing overall drought severity through integrated metrics
- Precipitation anomalies tracking deviations from long-term rainfall patterns
- Soil moisture deficit monitoring water availability in different soil layers
- Vegetation stress indicators assessing drought impacts on plant health and growth
- Temperature anomalies showing heat stress contributing to drought conditions
- Streamflow indicators monitoring river and reservoir water levels
Geographic Coverage
- European Union territories including all 27 member states
- United Kingdom continuing coverage post-Brexit for comparative analysis
- Regional detail providing information at national, regional, and local scales
- Cross-border coordination enabling regional drought assessment and cooperation
- Seasonal monitoring tracking drought development throughout agricultural and hydrological cycles
Technical Capabilities
- Satellite data integration using Earth observation for vegetation and soil moisture monitoring
- Meteorological networks incorporating ground-based precipitation and temperature measurements
- Ten-day update cycle ensuring timely information for decision-making
- Quality control procedures maintaining data accuracy and reliability
- Data download options providing access to historical and current datasets
- API access enabling integration with other monitoring and warning systems
Supporting Resources
- European Drought Impact Database (EDID) documenting historical drought impacts and damages
- World Drought Atlas providing global context for European drought patterns
- Drought Europe reports offering detailed analysis of current and recent drought events
- Scientific publications supporting research and knowledge development on drought monitoring
The European Drought Observatory serves as a critical infrastructure for drought preparedness across Europe, enabling coordinated responses to drought events and supporting climate adaptation strategies in an increasingly drought-prone environment.