Create population density maps
Map population density across any region with rich demographic data in minutes with Atlas
What is a population density map?
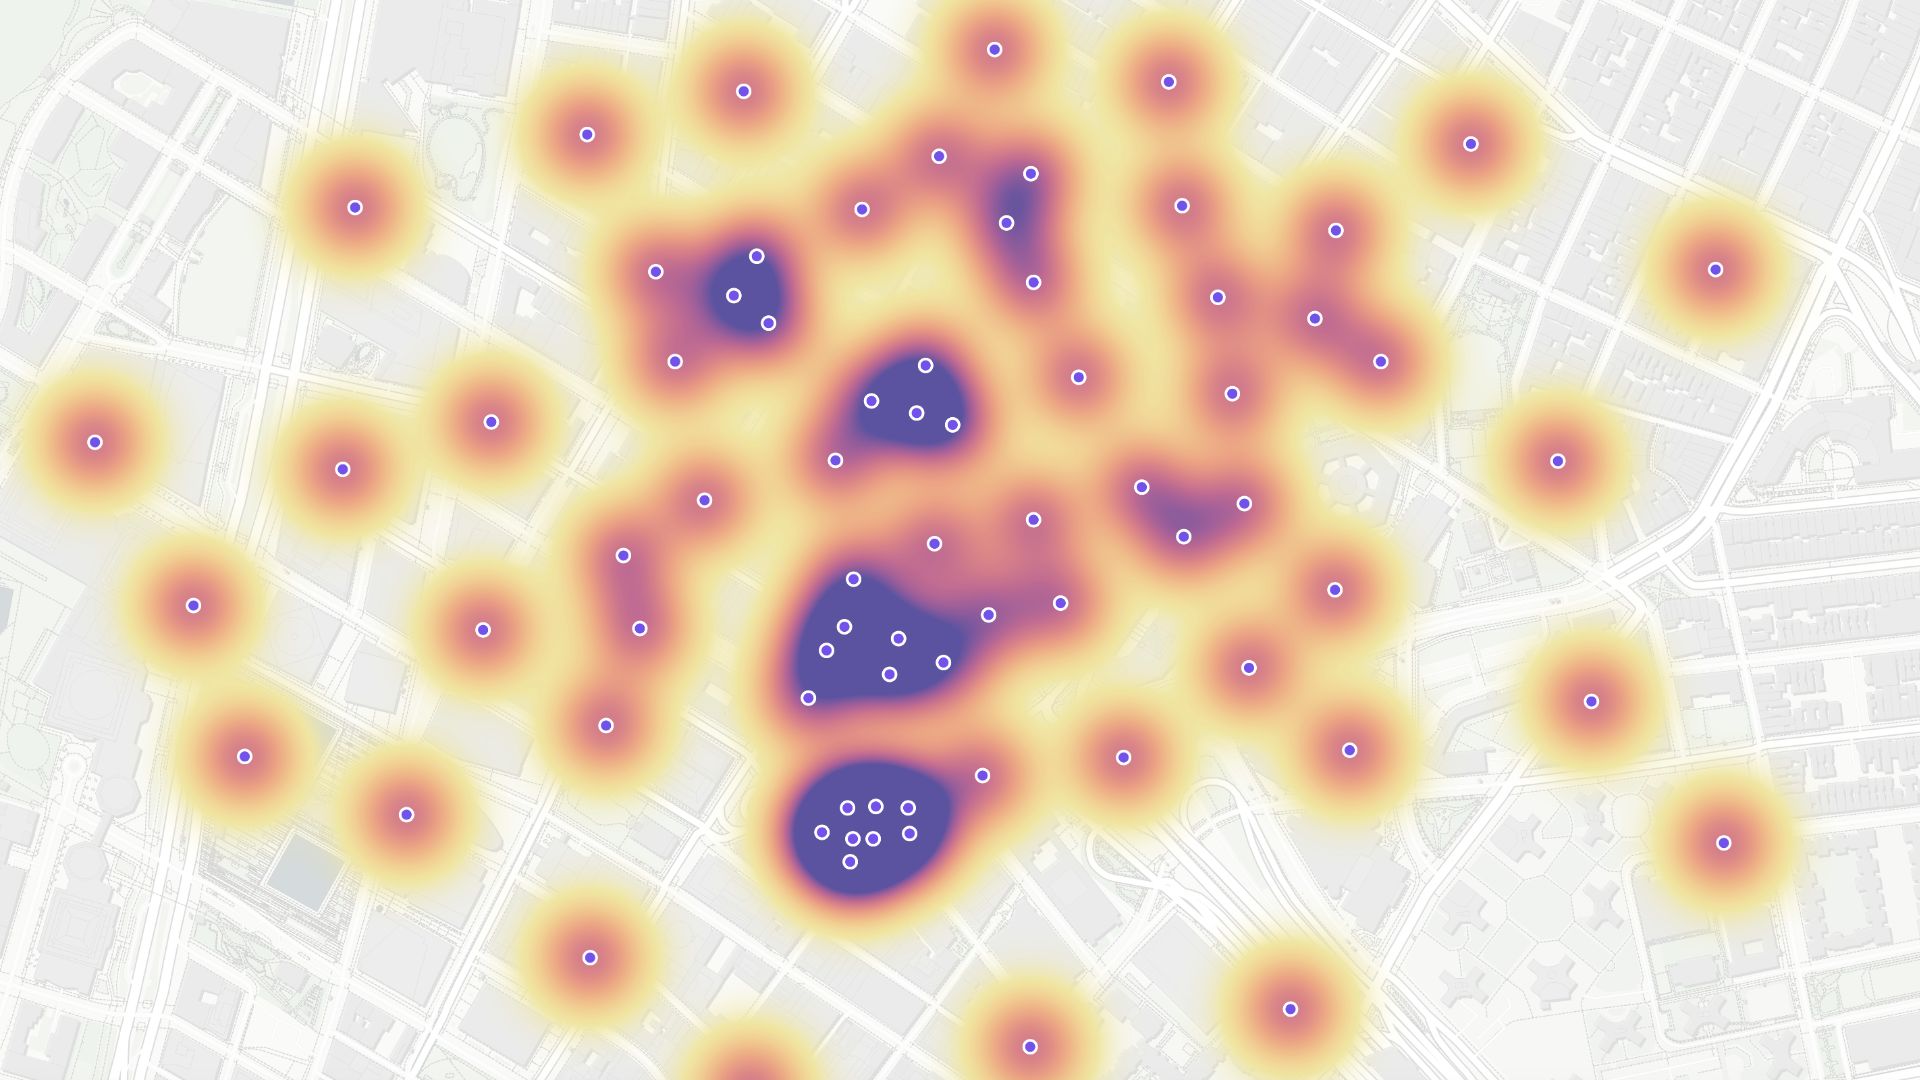
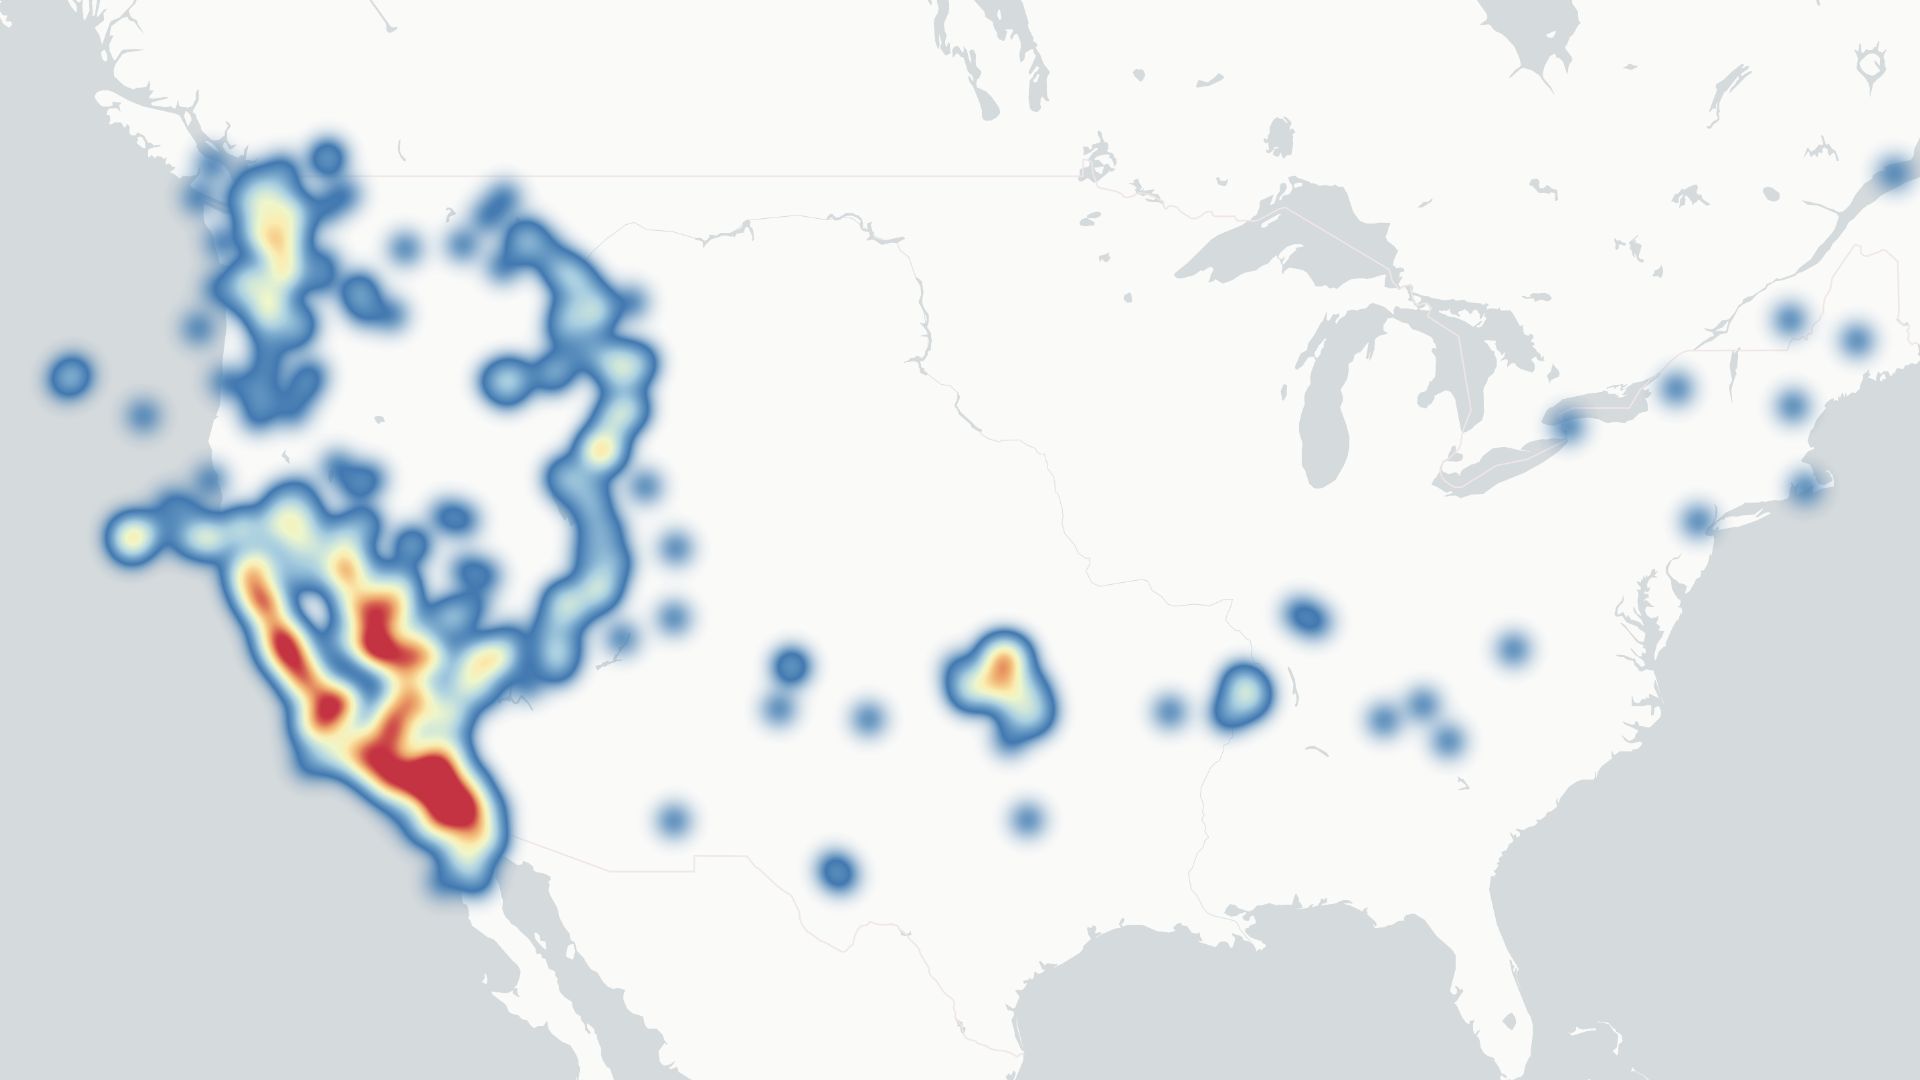
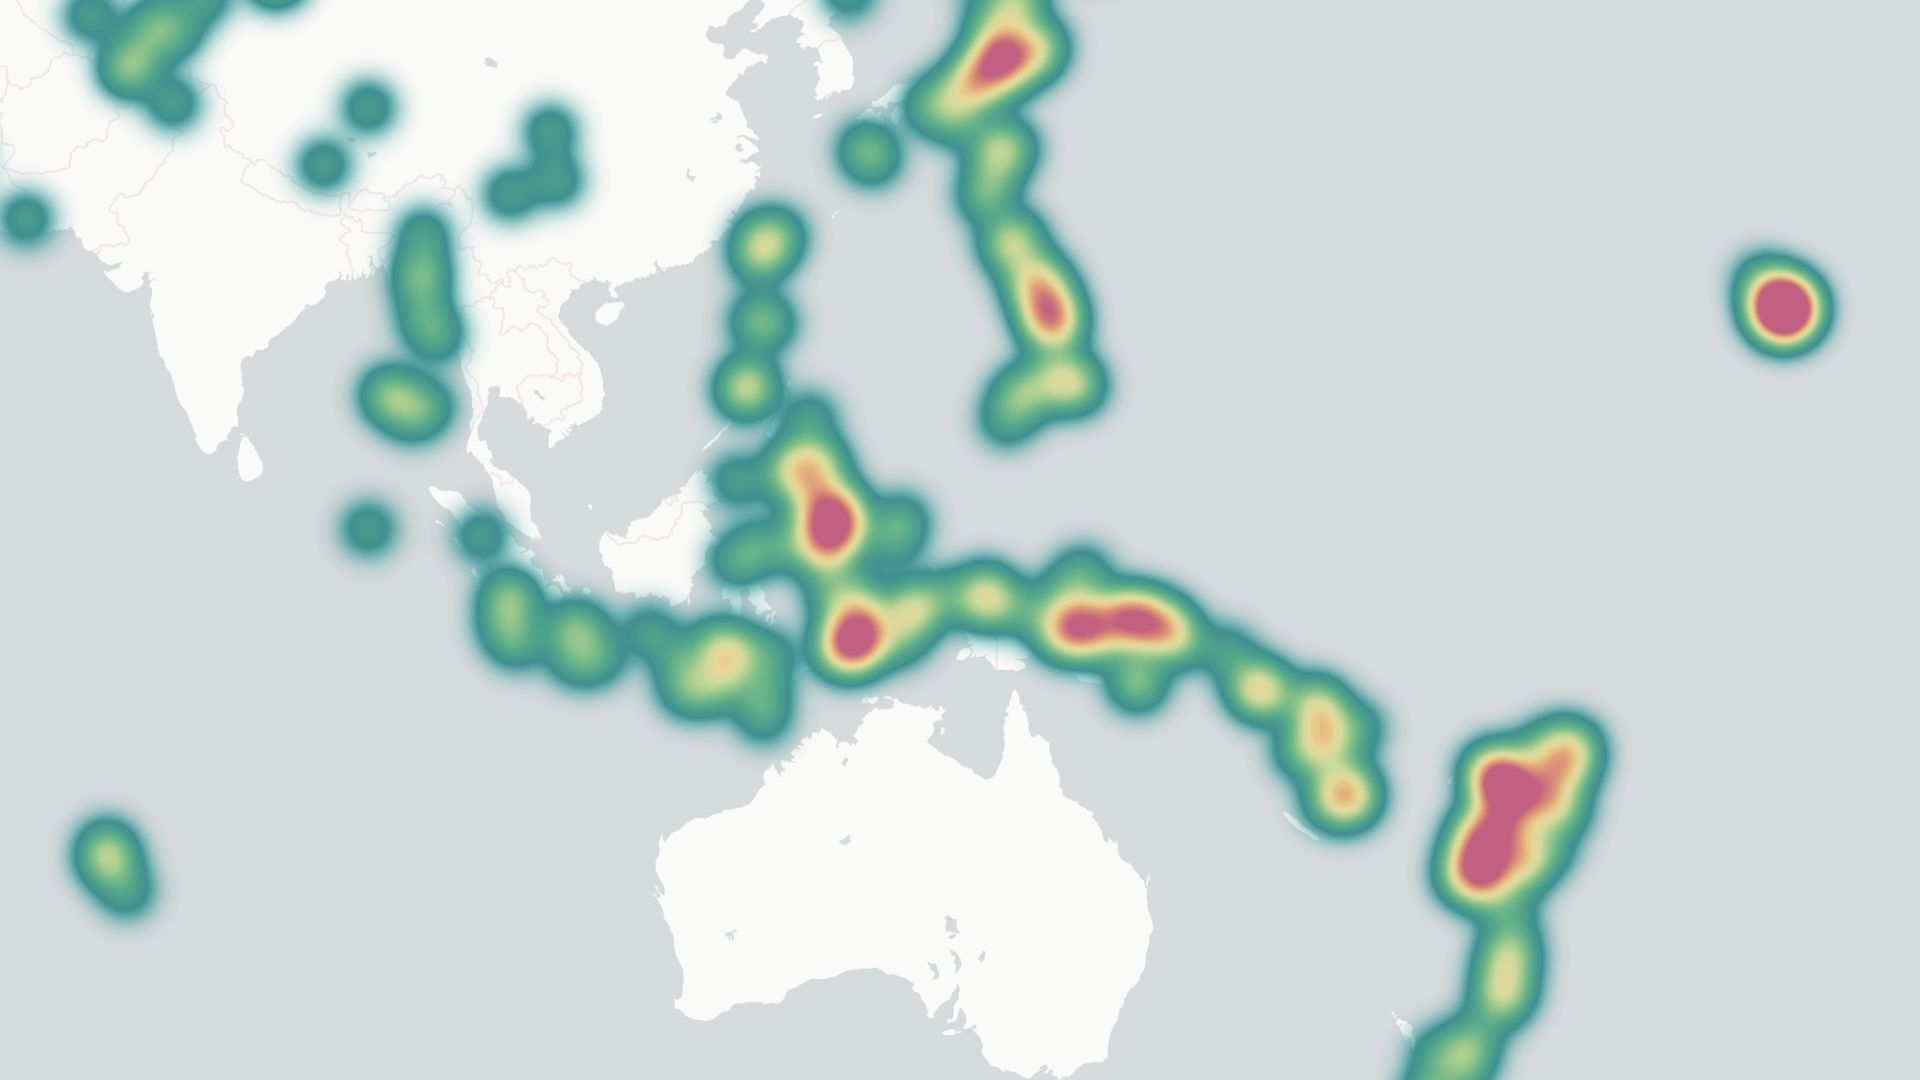
A population density map shows how many people live in each area using shaded colors. Denser areas appear in stronger tones, making it easy to spot urban centers, plan services, and understand where your audience is concentrated.
Create your first population density map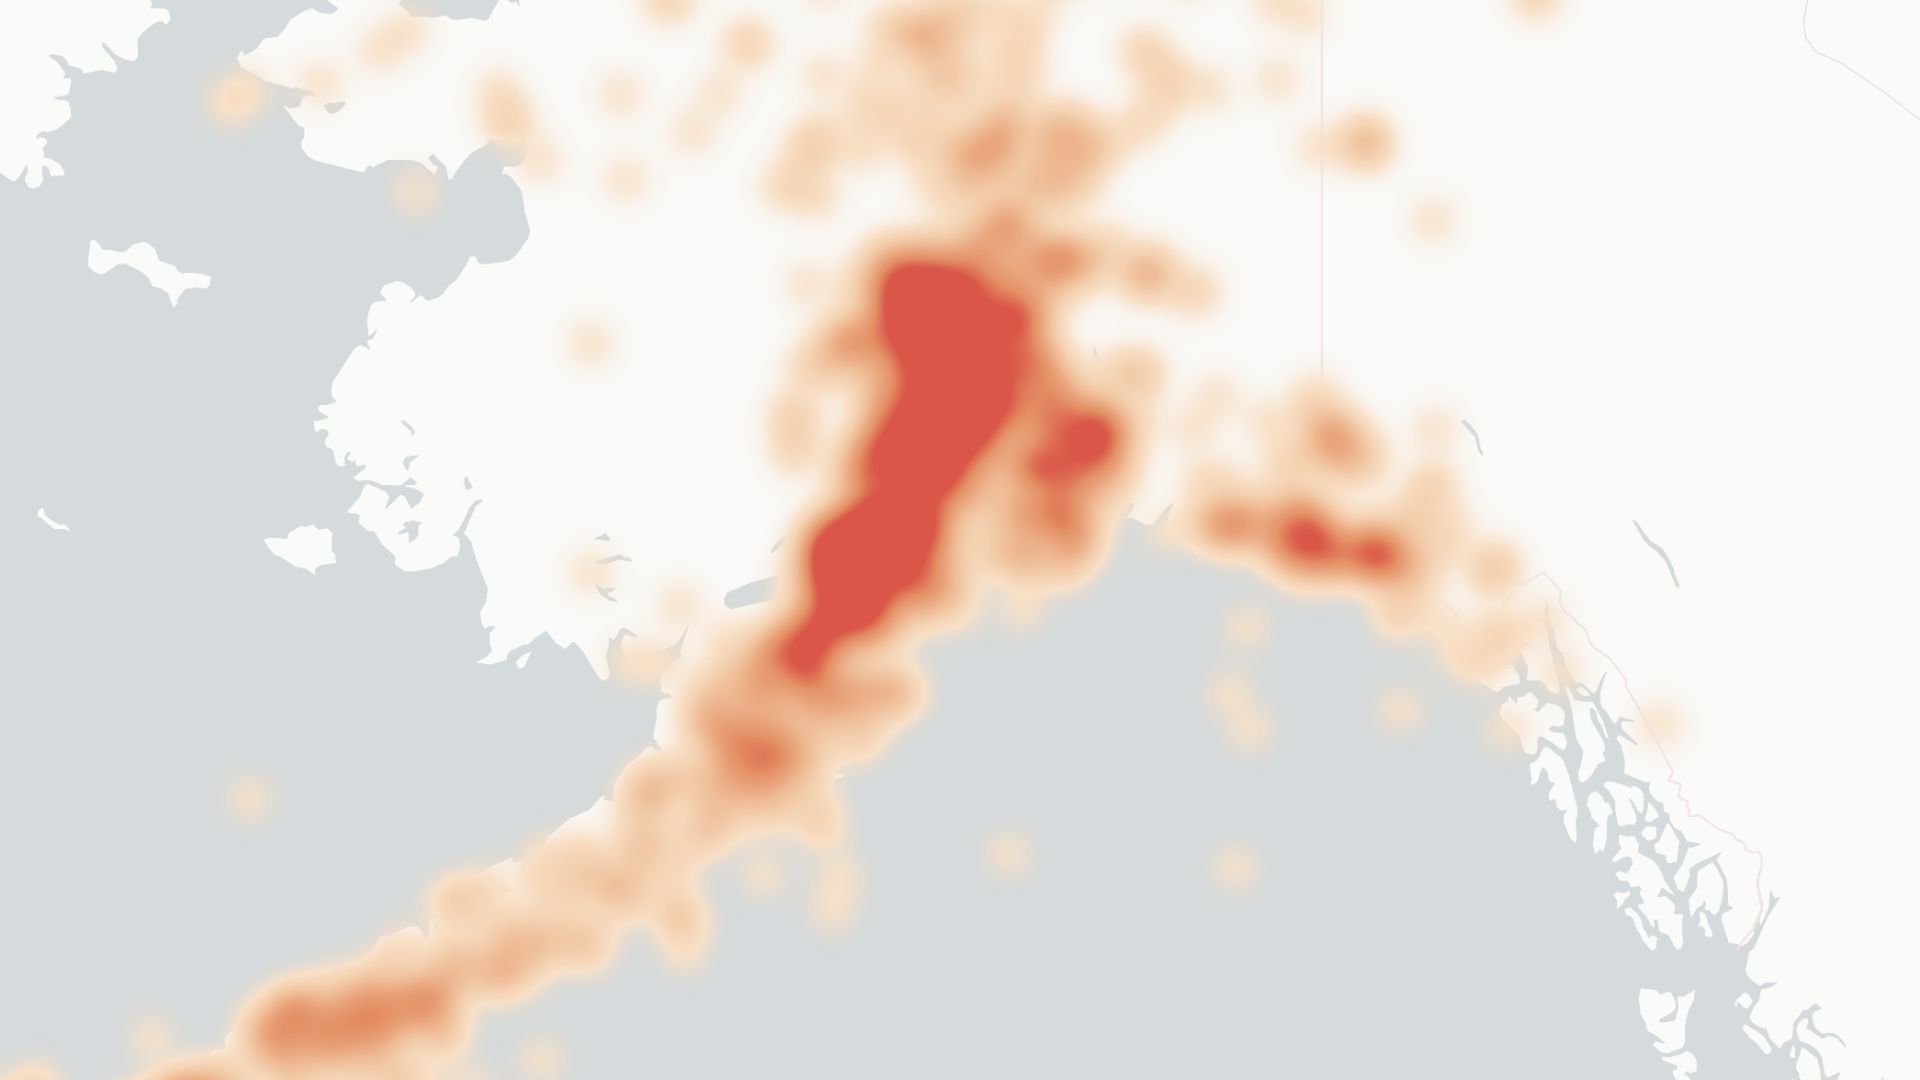
Examples of population density maps
Market sizing
See where your potential customers are concentrated
Urban planning
Plan infrastructure and services around population
Site selection
Choose locations with the right population nearby
How to create a population density map?
Choose your area
Pick a country, region, or custom boundary to map.
Add population data
Use built-in census data or upload your own figures.
Style the map
Pick a color scale and breaks for clear comparison.
Save and share
Download your map or share a link directly from Atlas.
Why choose Atlas for population density maps?
Atlas makes building population density maps fast and fully customizable, with powerful features for teams of any size.
Export high-quality maps
Download your map in multiple formats with no quality loss.
Integration-friendly
Connect with tools like Google Sheets, Salesforce, and more.
Real-time updates
See your data visualized the moment it changes.
Interactive visualization
Hover and click to explore data points in detail.
Custom branding
Add your logo and style for a professional touch.
Access from anywhere
Create and view maps on any device with an internet connection.
Frequently asked questions
Learn more about creating and using population density maps.