Create demographic maps
Use Atlas to map age, income, education, or other population statistics easily

What is a demographic map?
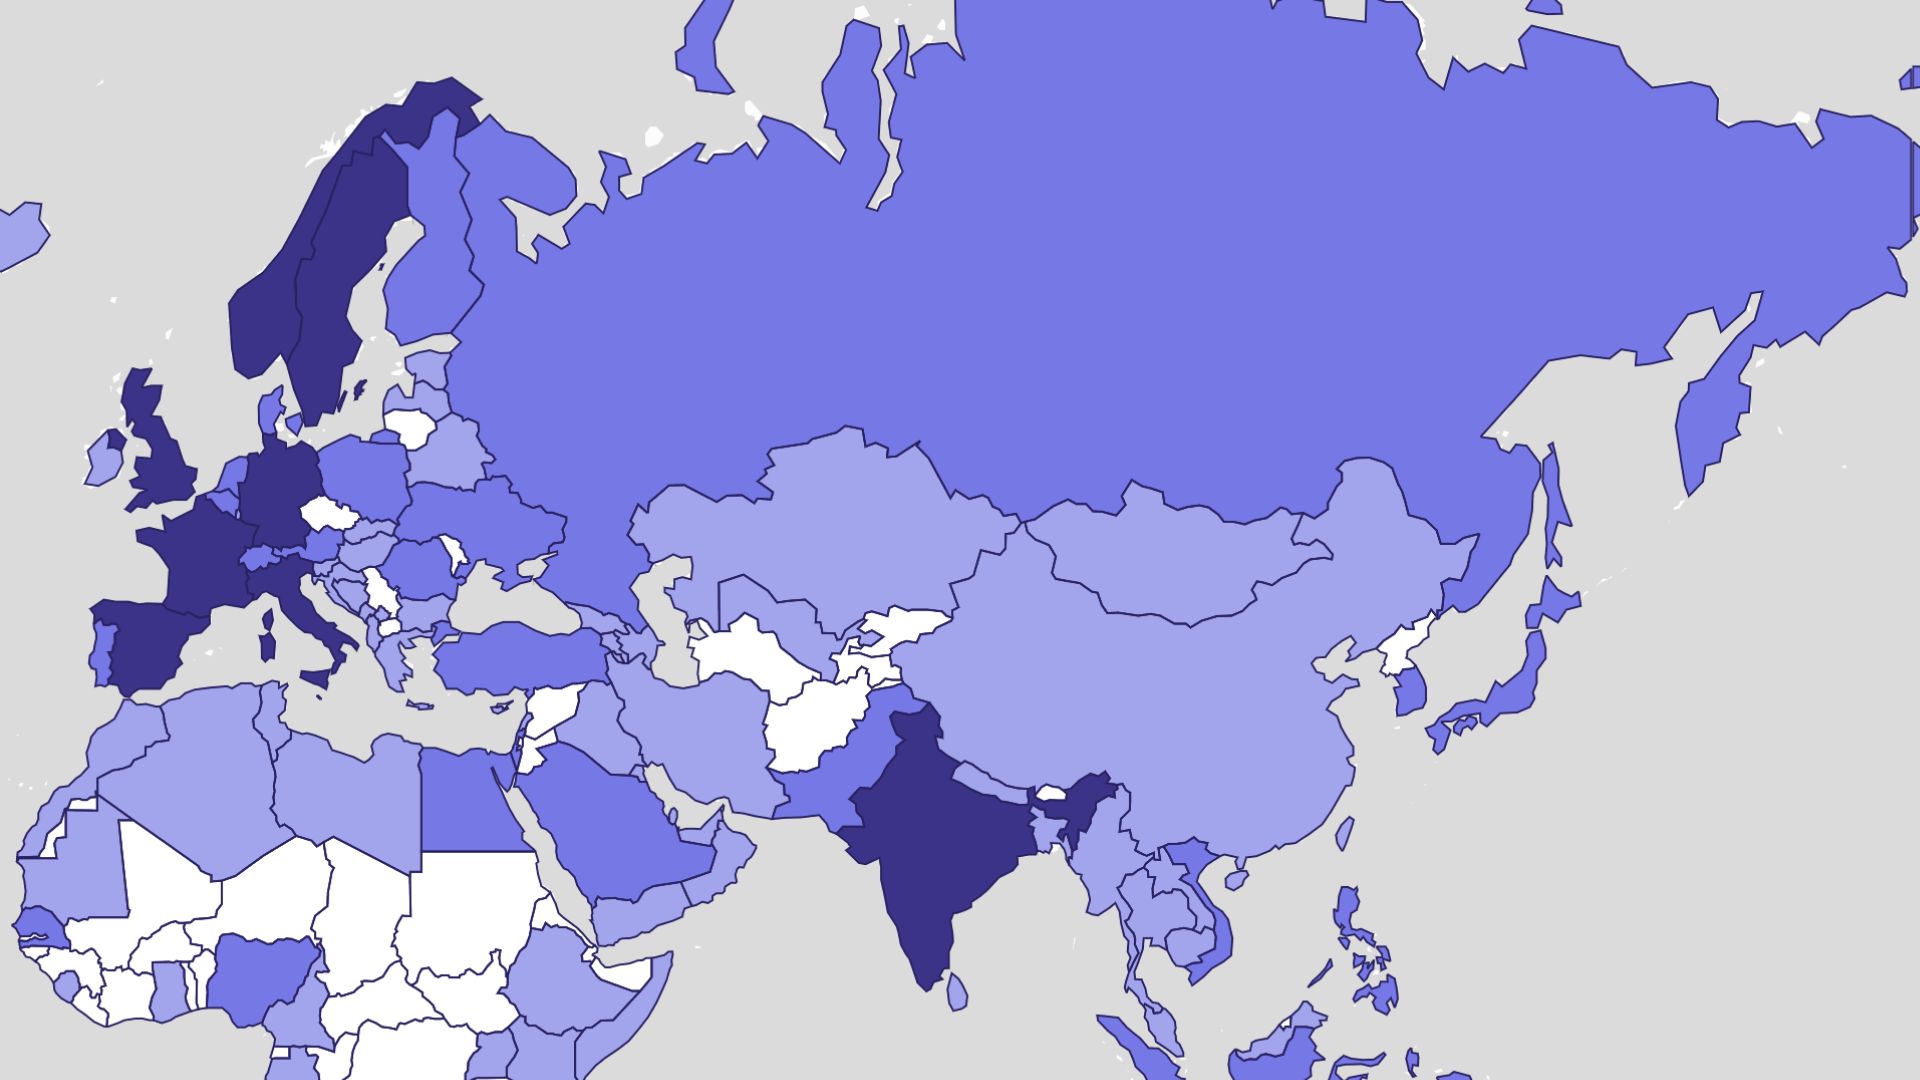
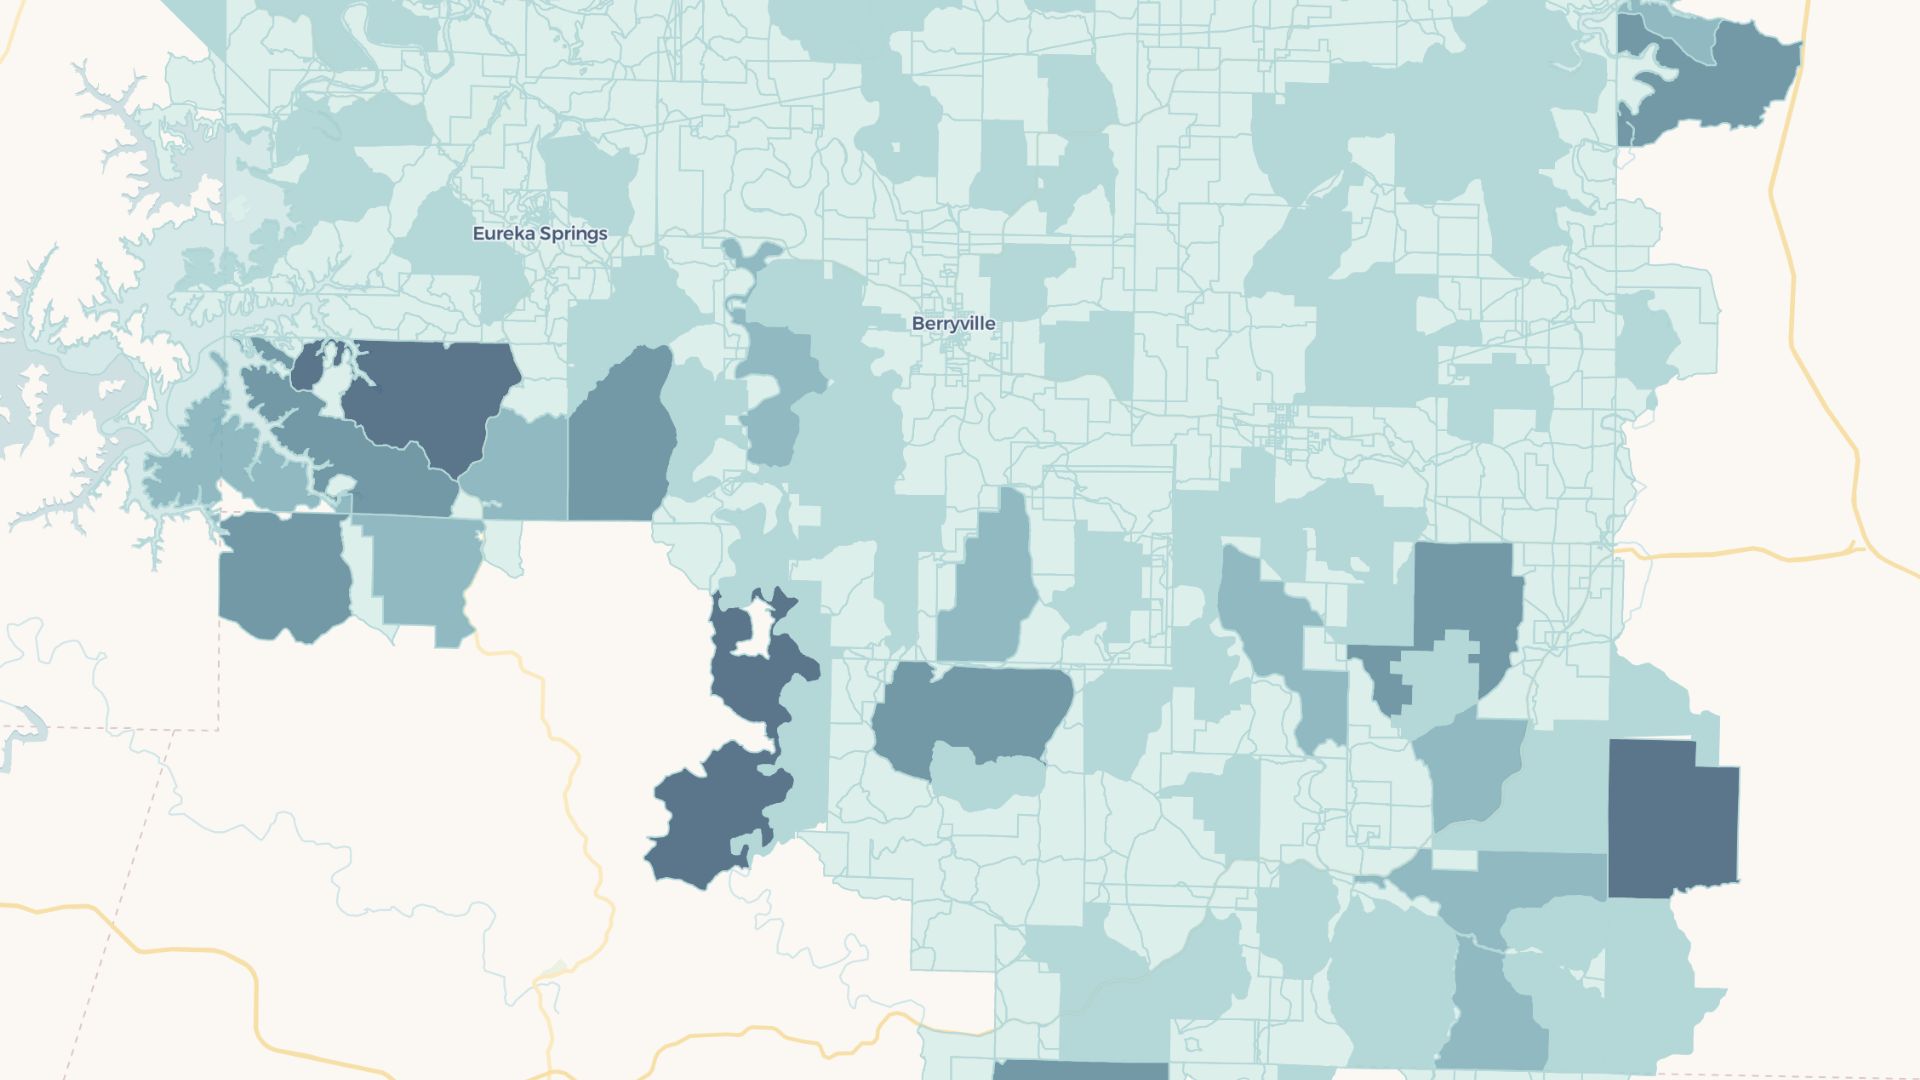
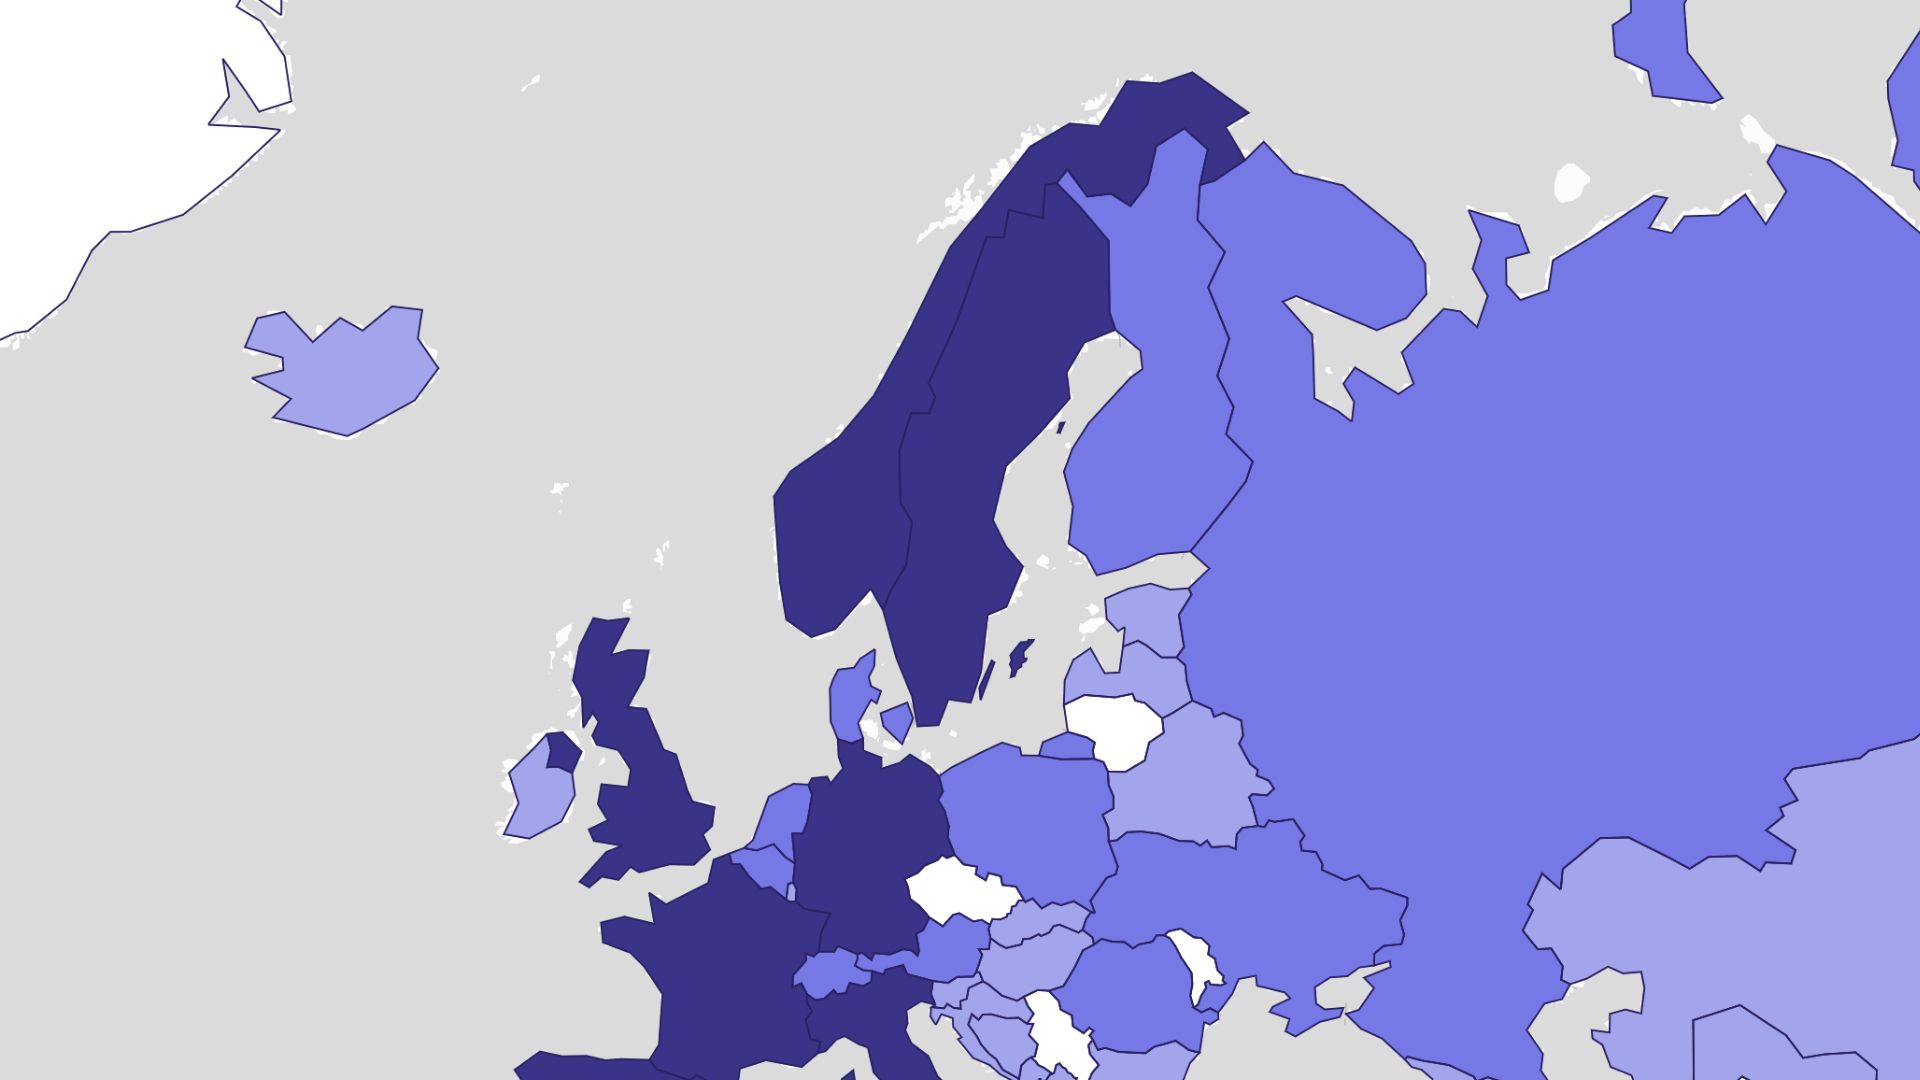
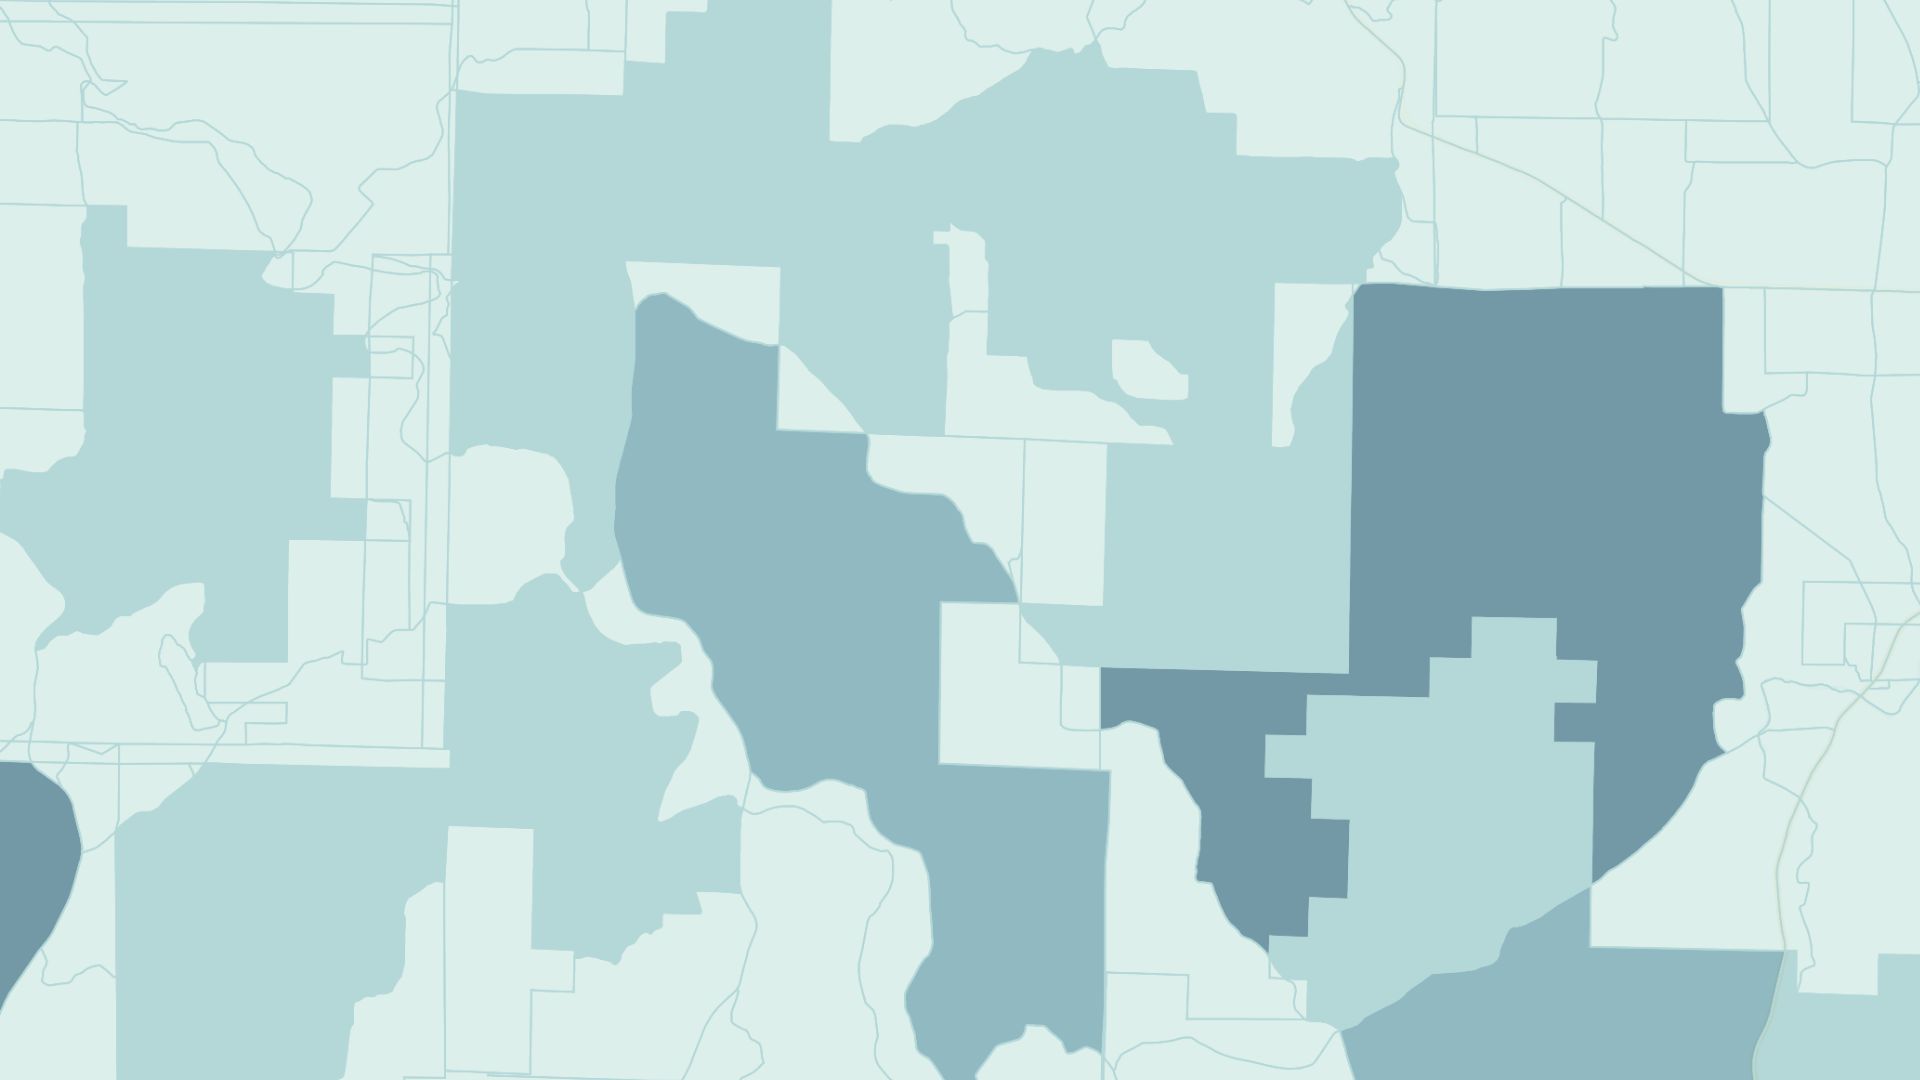
A demographic map displays population data like age, income, or education across regions. These maps help businesses, governments, and researchers understand population trends, target services, and plan resources effectively.
Create your first demographic map

Examples of demographic maps
Age distribution
Visualize areas with younger or older populations
Income levels
Identify income brackets by region for market targeting
Education levels
Map out regions with higher educational attainment
How to create demographic maps?
Upload demographic data
Import datasets containing population statistics by region.
Define geography
Select administrative boundaries like cities, counties, or zip codes.
Customize data layers
Choose specific metrics like age, income, or population density.
Save and analyze
Review the map, save it, or share it with your stakeholders.
Why choose Atlas for demographic maps?
Atlas offers powerful tools for exploring and presenting demographic data.
Dynamic filtering
Focus on specific population segments with interactive filters.
Data overlays
Combine demographic data with sales, infrastructure, or hazard data.
Custom gradients
Create unique color schemes to match your presentation style.
Data updates
Refresh maps with new datasets for the latest insights.
Export-ready designs
Download high-quality maps for reports or presentations.
Collaborative tools
Share maps and collaborate with your team in real time.
Frequently asked questions
Learn more about creating and using demographic maps.
