
Voronoi diagrams are a fundamental tool in spatial analysis, used to divide space into regions based on proximity to a set of points. These regions, or cells, help in understanding relationships and patterns in geographic data.
What Are Voronoi Diagrams?
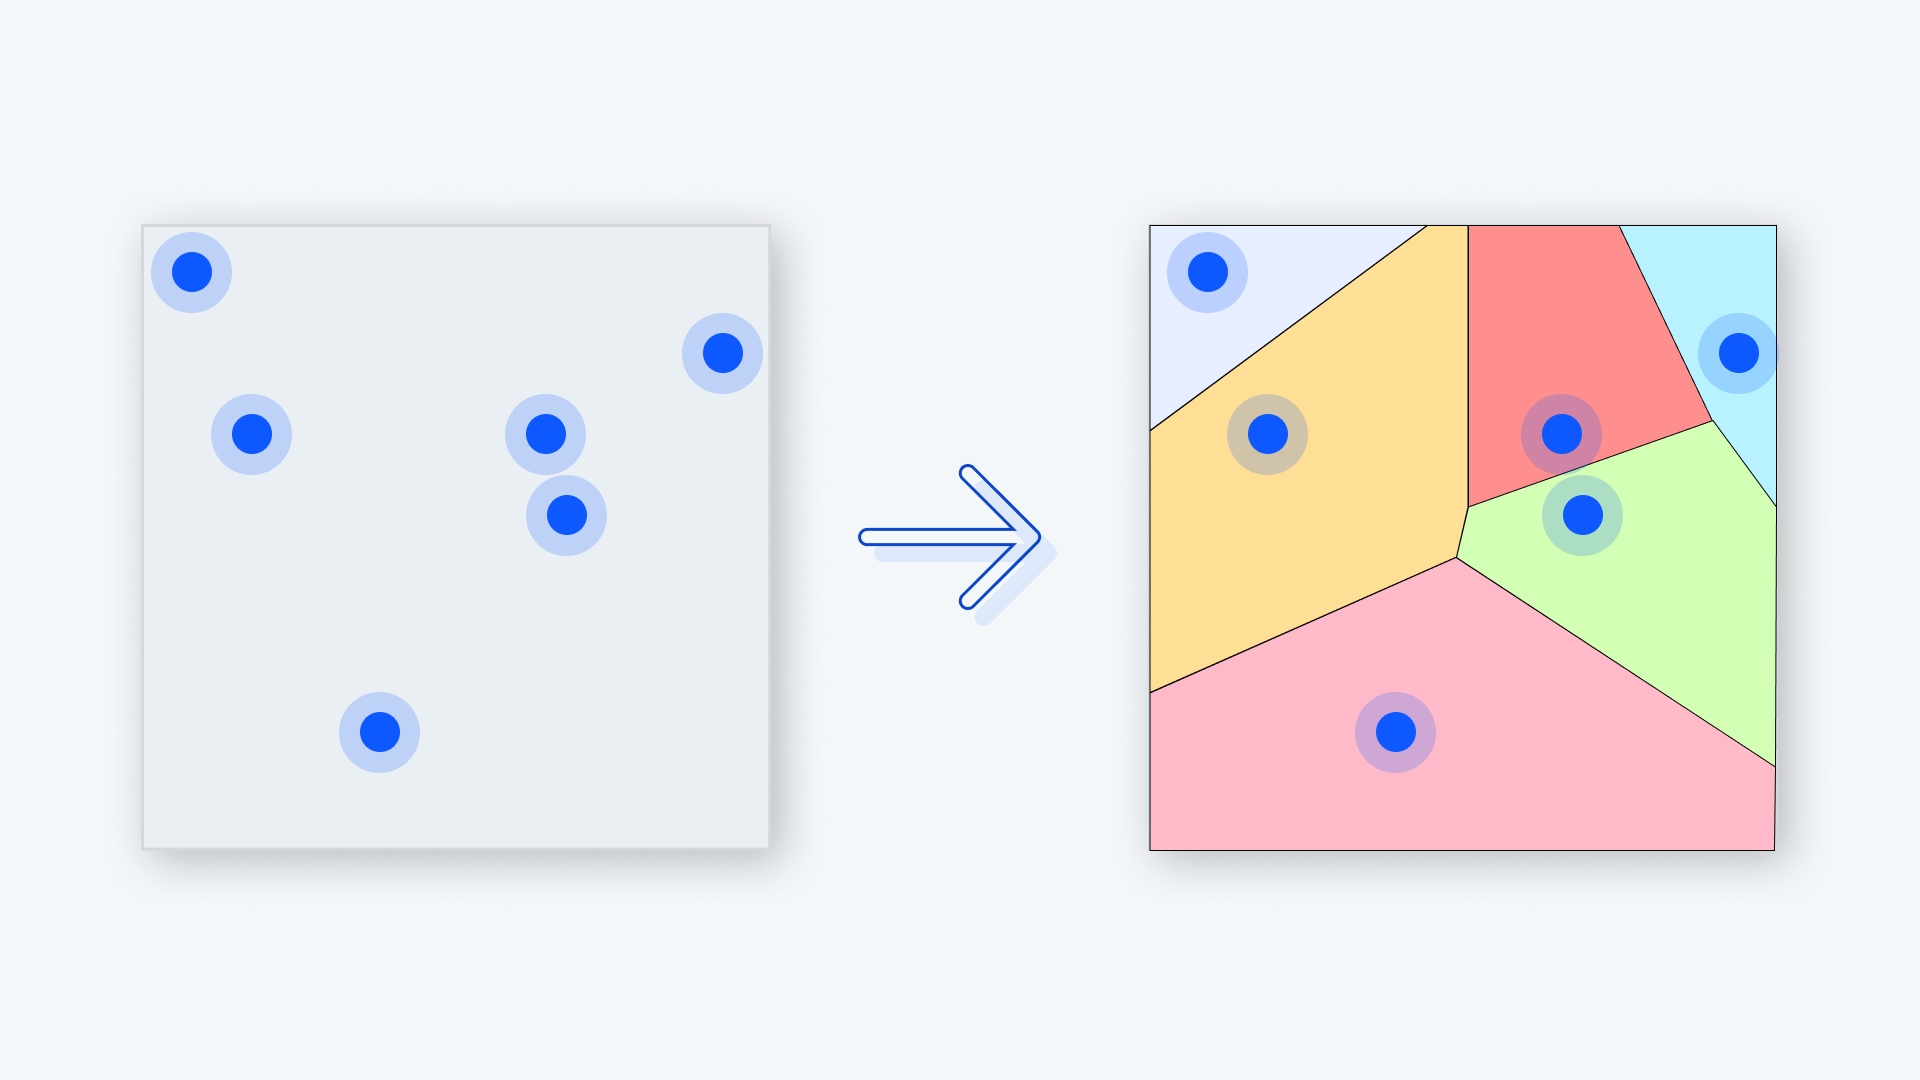
A Voronoi diagram is a partitioning of a plane into regions where every point in a region is closer to its designated point (called a seed or site) than to any other seed. This geometric construct is versatile and has applications across many industries.
Common Applications of Voronoi Diagrams
1. Urban Planning
Urban planners use Voronoi diagrams to allocate resources like schools, hospitals, or fire stations by determining their areas of influence.
2. Telecommunications
Voronoi diagrams model cell tower coverage. Each cell represents the area served by a specific tower, ensuring optimal placement.
3. Retail Site Selection
Retailers use Voronoi diagrams to analyze trade areas and optimize store locations to maximize customer accessibility.
4. Natural Resource Management
These diagrams help in mapping watershed areas or understanding animal territories based on proximity to resources like water bodies.
5. Public Health
Public health professionals use them to study accessibility to healthcare facilities, identifying underserved regions for intervention.
Tools to Create Voronoi Diagrams
Creating Voronoi diagrams doesn’t require advanced technical skills, thanks to modern GIS tools. Here are some common methods:
1. Using GIS Platforms
Browser-based GIS tools like Atlas allow users to create Voronoi diagrams directly in their browser. These platforms are user-friendly and require no coding.
2. QGIS or ArcGIS
Desktop GIS tools provide built-in features for generating Voronoi diagrams. These are ideal for detailed spatial analyses.
3. Python Libraries
For developers, libraries like scipy.spatial in Python offer robust methods to create and customize Voronoi diagrams.
1import numpy as np
2from scipy.spatial import Voronoi, voronoi_plot_2d
3import matplotlib.pyplot as plt
4from shapely.geometry import Polygon
5Step 1: Define Points (as coordinates)
6points = np.array([
7[2, 3],
8[5, 4],
9[1, 8],
10[6, 1],
11[8, 9]
12])
13Step 2: Generate Voronoi Diagram
14vor = Voronoi(points)
15Step 3: Visualize Voronoi Diagram (optional)
16voronoi_plot_2d(vor)
17plt.scatter(points[:, 0], points[:, 1], color='red')  # Plot input points
18plt.title("Voronoi Diagram (Thiessen Polygons)")
19plt.show()
20Step 4: Convert Voronoi Regions to Polygons
21def voronoi_to_polygons(vor):
22"""Convert Voronoi diagram regions into polygons."""
23polygons = []
24for region_index in vor.regions:
25if not region_index or -1 in region_index:
26# Skip regions with no vertices or unbounded areas
27continue
28polygon = [vor.vertices[i] for i in region_index]
29polygons.append(Polygon(polygon))
30return polygons
31Generate Thiessen Polygons
32thiessen_polygons = voronoi_to_polygons(vor)
33Step 5: Visualize Polygons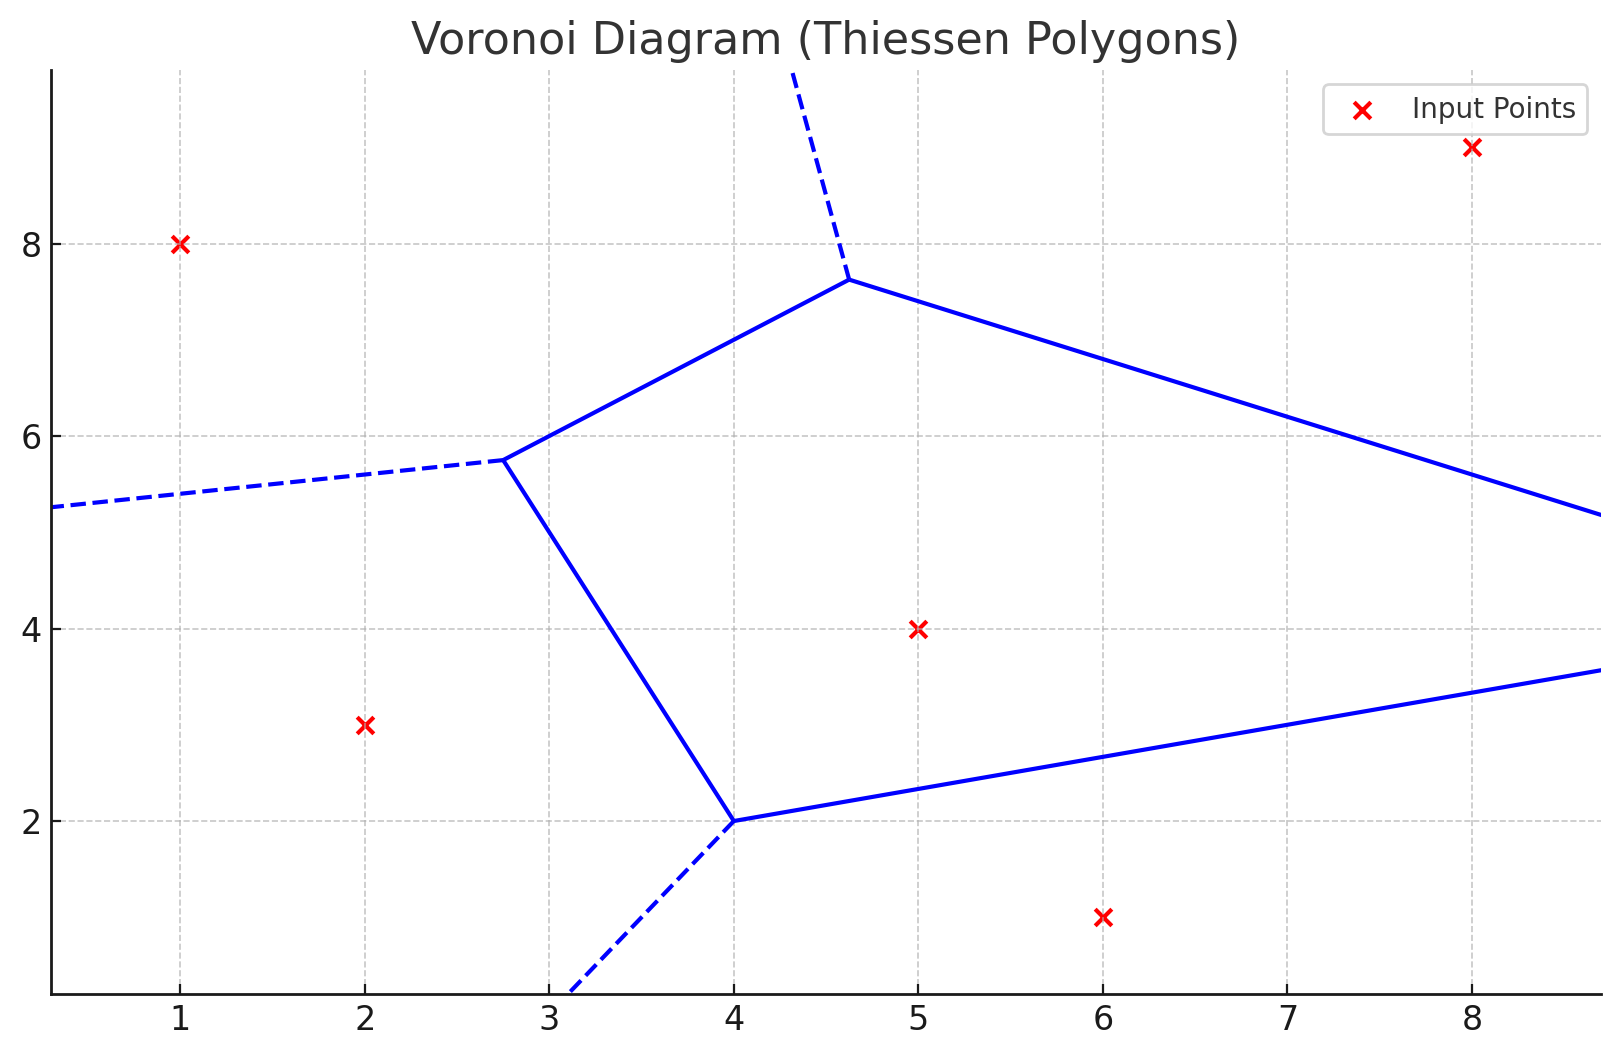
4. Online Tools
Platforms like GeoGebra or interactive web-based tools can create simple Voronoi diagrams for quick visualization.
Creating Voronoi Diagrams in Atlas
With Atlas, you can generate Voronoi diagrams effortlessly:
- Upload Data: Add your dataset containing seed points (e.g., locations of schools or stores).
- Navigate to the Voronoi Analysis: You can find the Voronoi Analysis under Vector Operations in the right panel.
- Analyze and Share: Layer additional data for deeper insights and share interactive maps with your team.
Voronoi diagrams are powerful tools for visualizing spatial relationships. Whether you're planning urban infrastructure, managing resources, or analyzing customer distribution, these diagrams simplify complex spatial data.
With tools like Atlas, creating and using Voronoi diagrams has never been easier. Dive into spatial analysis today and unlock new insights.


