Travel time data is a game-changer in location analysis. It's not just about crunching numbers; it's about uncovering insights that can shape crucial decisions in real estate, retail, and transportation planning.
In this post, we'll take a closer look at how different industries are tapping into travel time data to gain valuable insights and make smarter business moves.
Let's dive in for some inspiration!
Running a Travel Time Analysis in Atlas
The Travel Time Analysis tool is used to compute the region accessible within a designated travel time or distance along a street network, depending on the chosen travel mode.
The output is a hosted vector layer.
Travel Time Analysis Settings
The Travel Time Analysis settings include the following parameters:
- Travel Mode is the travel mode the travel areas will be based on. Travel modes are based on travel time or travel distance. Choose between (1) Walking, (2) Cycling, (3) Driving
- Travel Time is the travel time limit for each input point. Multiple cutoffs can be added to create outputs based on different travel times. Maximum travel time is 60 minutes.
Example: Mapping the Reach of EV Charging Stations in Sardinia, Italy
Residents in Sardinia, Italy are considering transitioning to electric vehicles to reduce their carbon footprint. Generate Travel Areas can be used to outline travel ranges around charging stations, helping determine which areas of the island are accessible with electric vehicles.
1. Sign up in Atlas
If you don’t already have a user, create a free starter user here: Sign Up
2. Create a new project
After you have completed the onboarding wizard, create a new project.
3. Upload the data
Upload the following data:
- EV_Charging.geojson
- Primary_Roads.geojson
- Secondary_Roads.geojson
4. Run the Travel Time Analysis
Navigate to Data Actions and search for Travel Time Analysis. In the input field, switch to datasets and select the EV_Charging layer as input.
Select 30-minute and 60-minute as travel time, and driving as transportation method.
Finally, click Run.
5. Post-processing and clean-up
First, since the 30-minute and 60-minute layers are overlapping, we want to remove the overlapping part of the 60-minute layer to create a cleaner look. First, select the 60-minute layer, hold the shift command, and then select the 30-minute layer. While you have selected both layers, click on the subtract operation from the Basic Operations.
Secondly, we want to improve the visualization:
- EV_Charging: download this symbol (EV_Charging.png). Select the layer and navigate to styling. Remove both fill and outline. Navigate to Labels and Symbol and add the
EV_Charging.png. Change the Icon Size to 2 px and Allow overlap. - 30-minute Travel Time: select
#10a300as fill color and change the opacity to 30%. Then remove the outline. - 60-minute Travel Time: select
#ff6f00as fill color and change the opacity to 50%. Then remove the outline. - Primary roads: select
#616161as the outline color - Secondary roads: select
#000000as the outline color, set width to 1 px, and style to dotted.
10 Applications for Travel Time Analysis
We’ve already looked at one application for Travel Time Analysis. Let’s look at 10 more!
1. Determining the value of a property
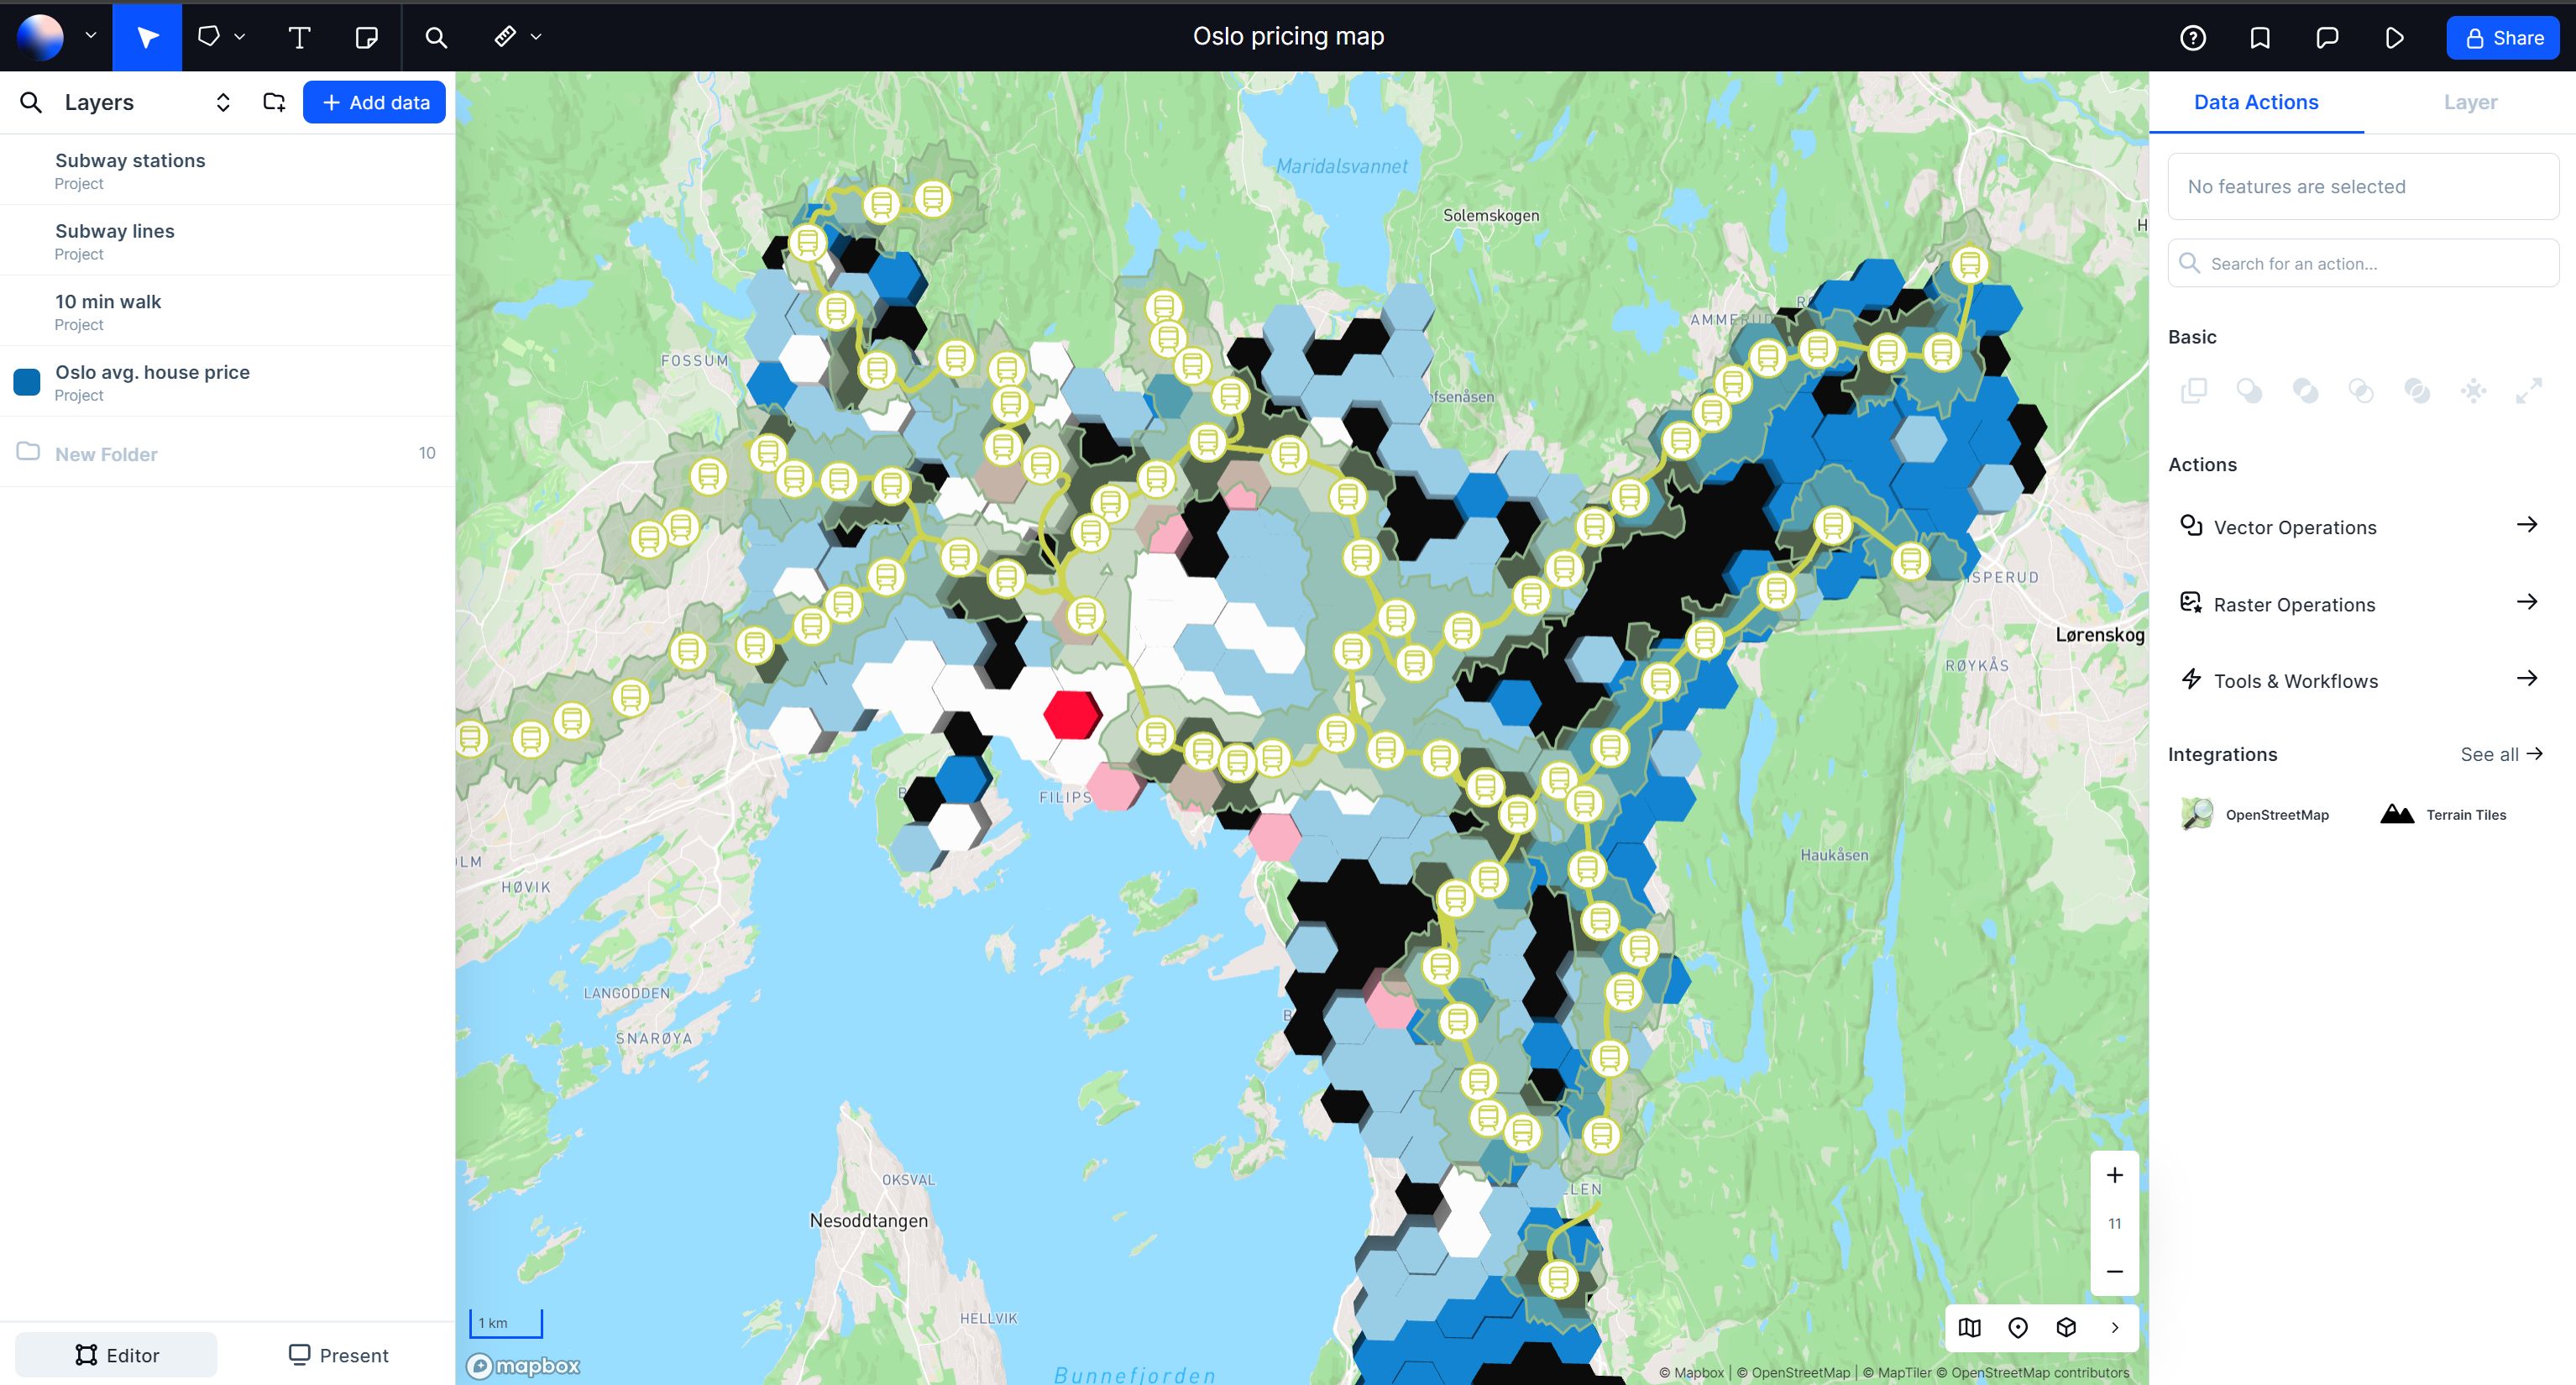
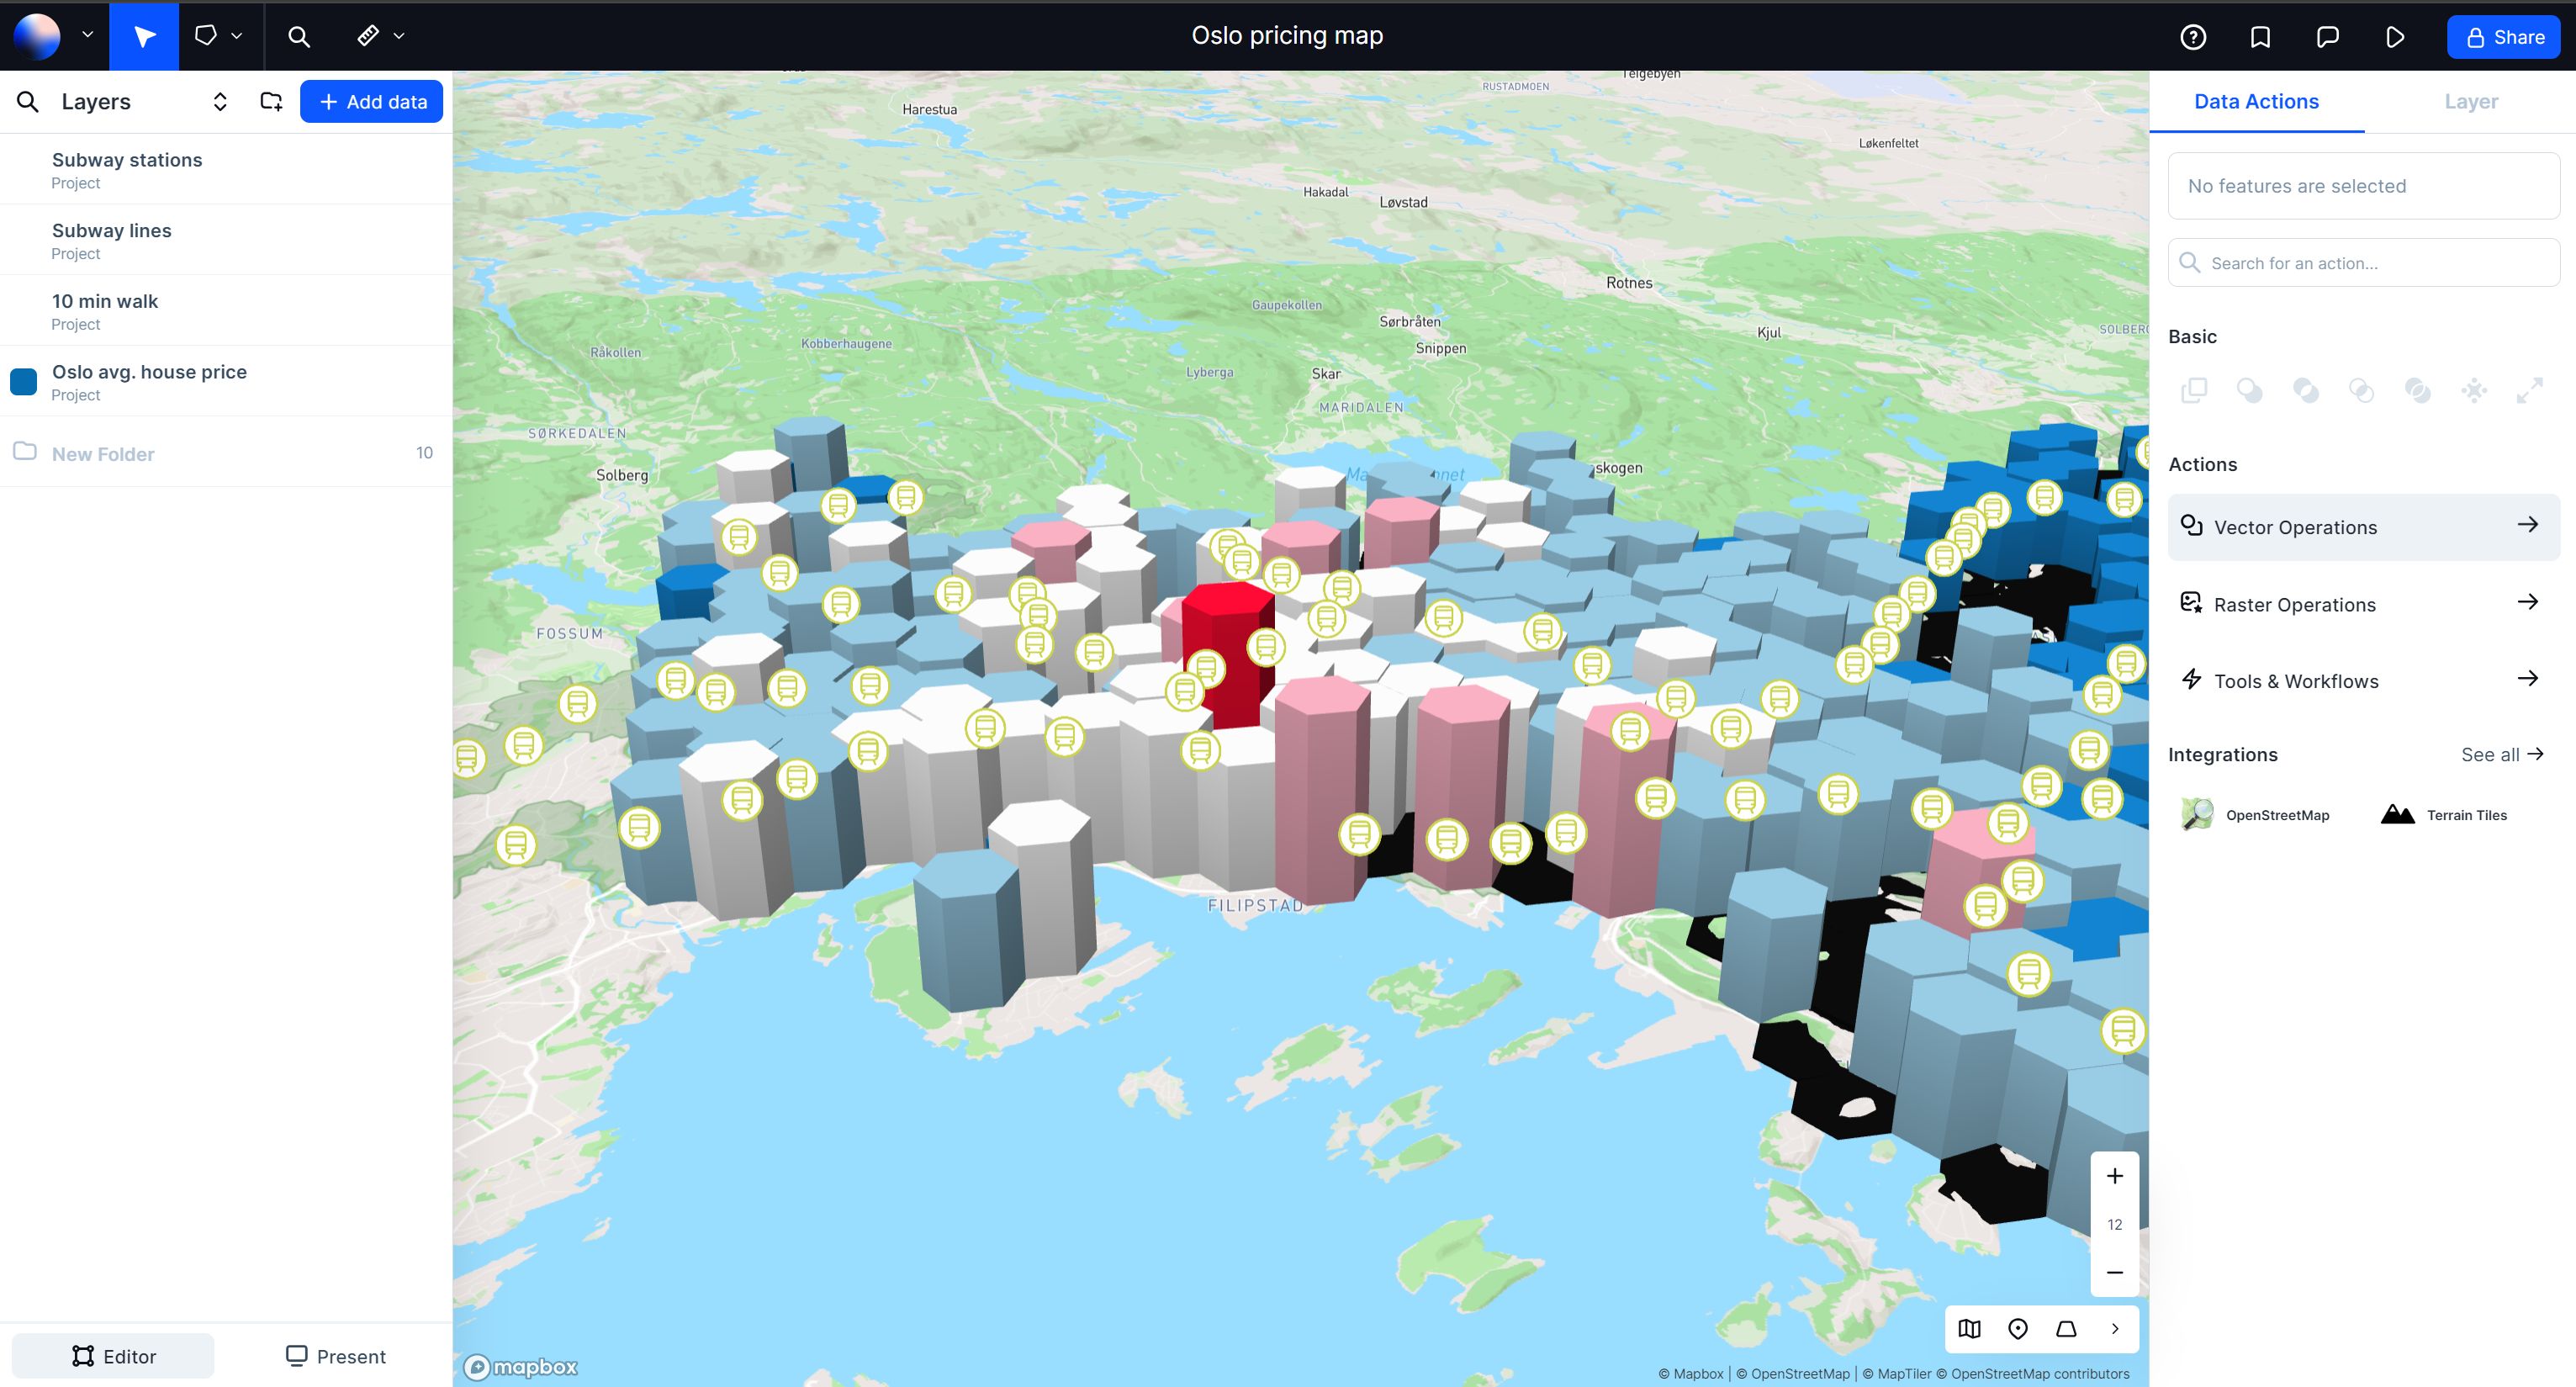
Travel time data can be utilized within your geospatial analysis to evaluate how travel times influence the worth of a commercial or residential property. This might involve tasks such as determining the closeness of a property to essential amenities such as schools, fitness centers, or public transportation connections.
In the map below, a 10-minute walking catchment area around subway stations in Oslo is visualized together with property prices.
2. Evaluating the effect of a new office location on employee commuting durations
When considering an office relocation or expansion to a new location, leveraging travel time data can help evaluate the commuting distances for employees.
Analyzing the commute times of employees across potential office locations enables selecting the most convenient location for staff.
Similarly, employing a comparable analysis aids in optimizing employee allocation among multiple existing offices, considering commute convenience.
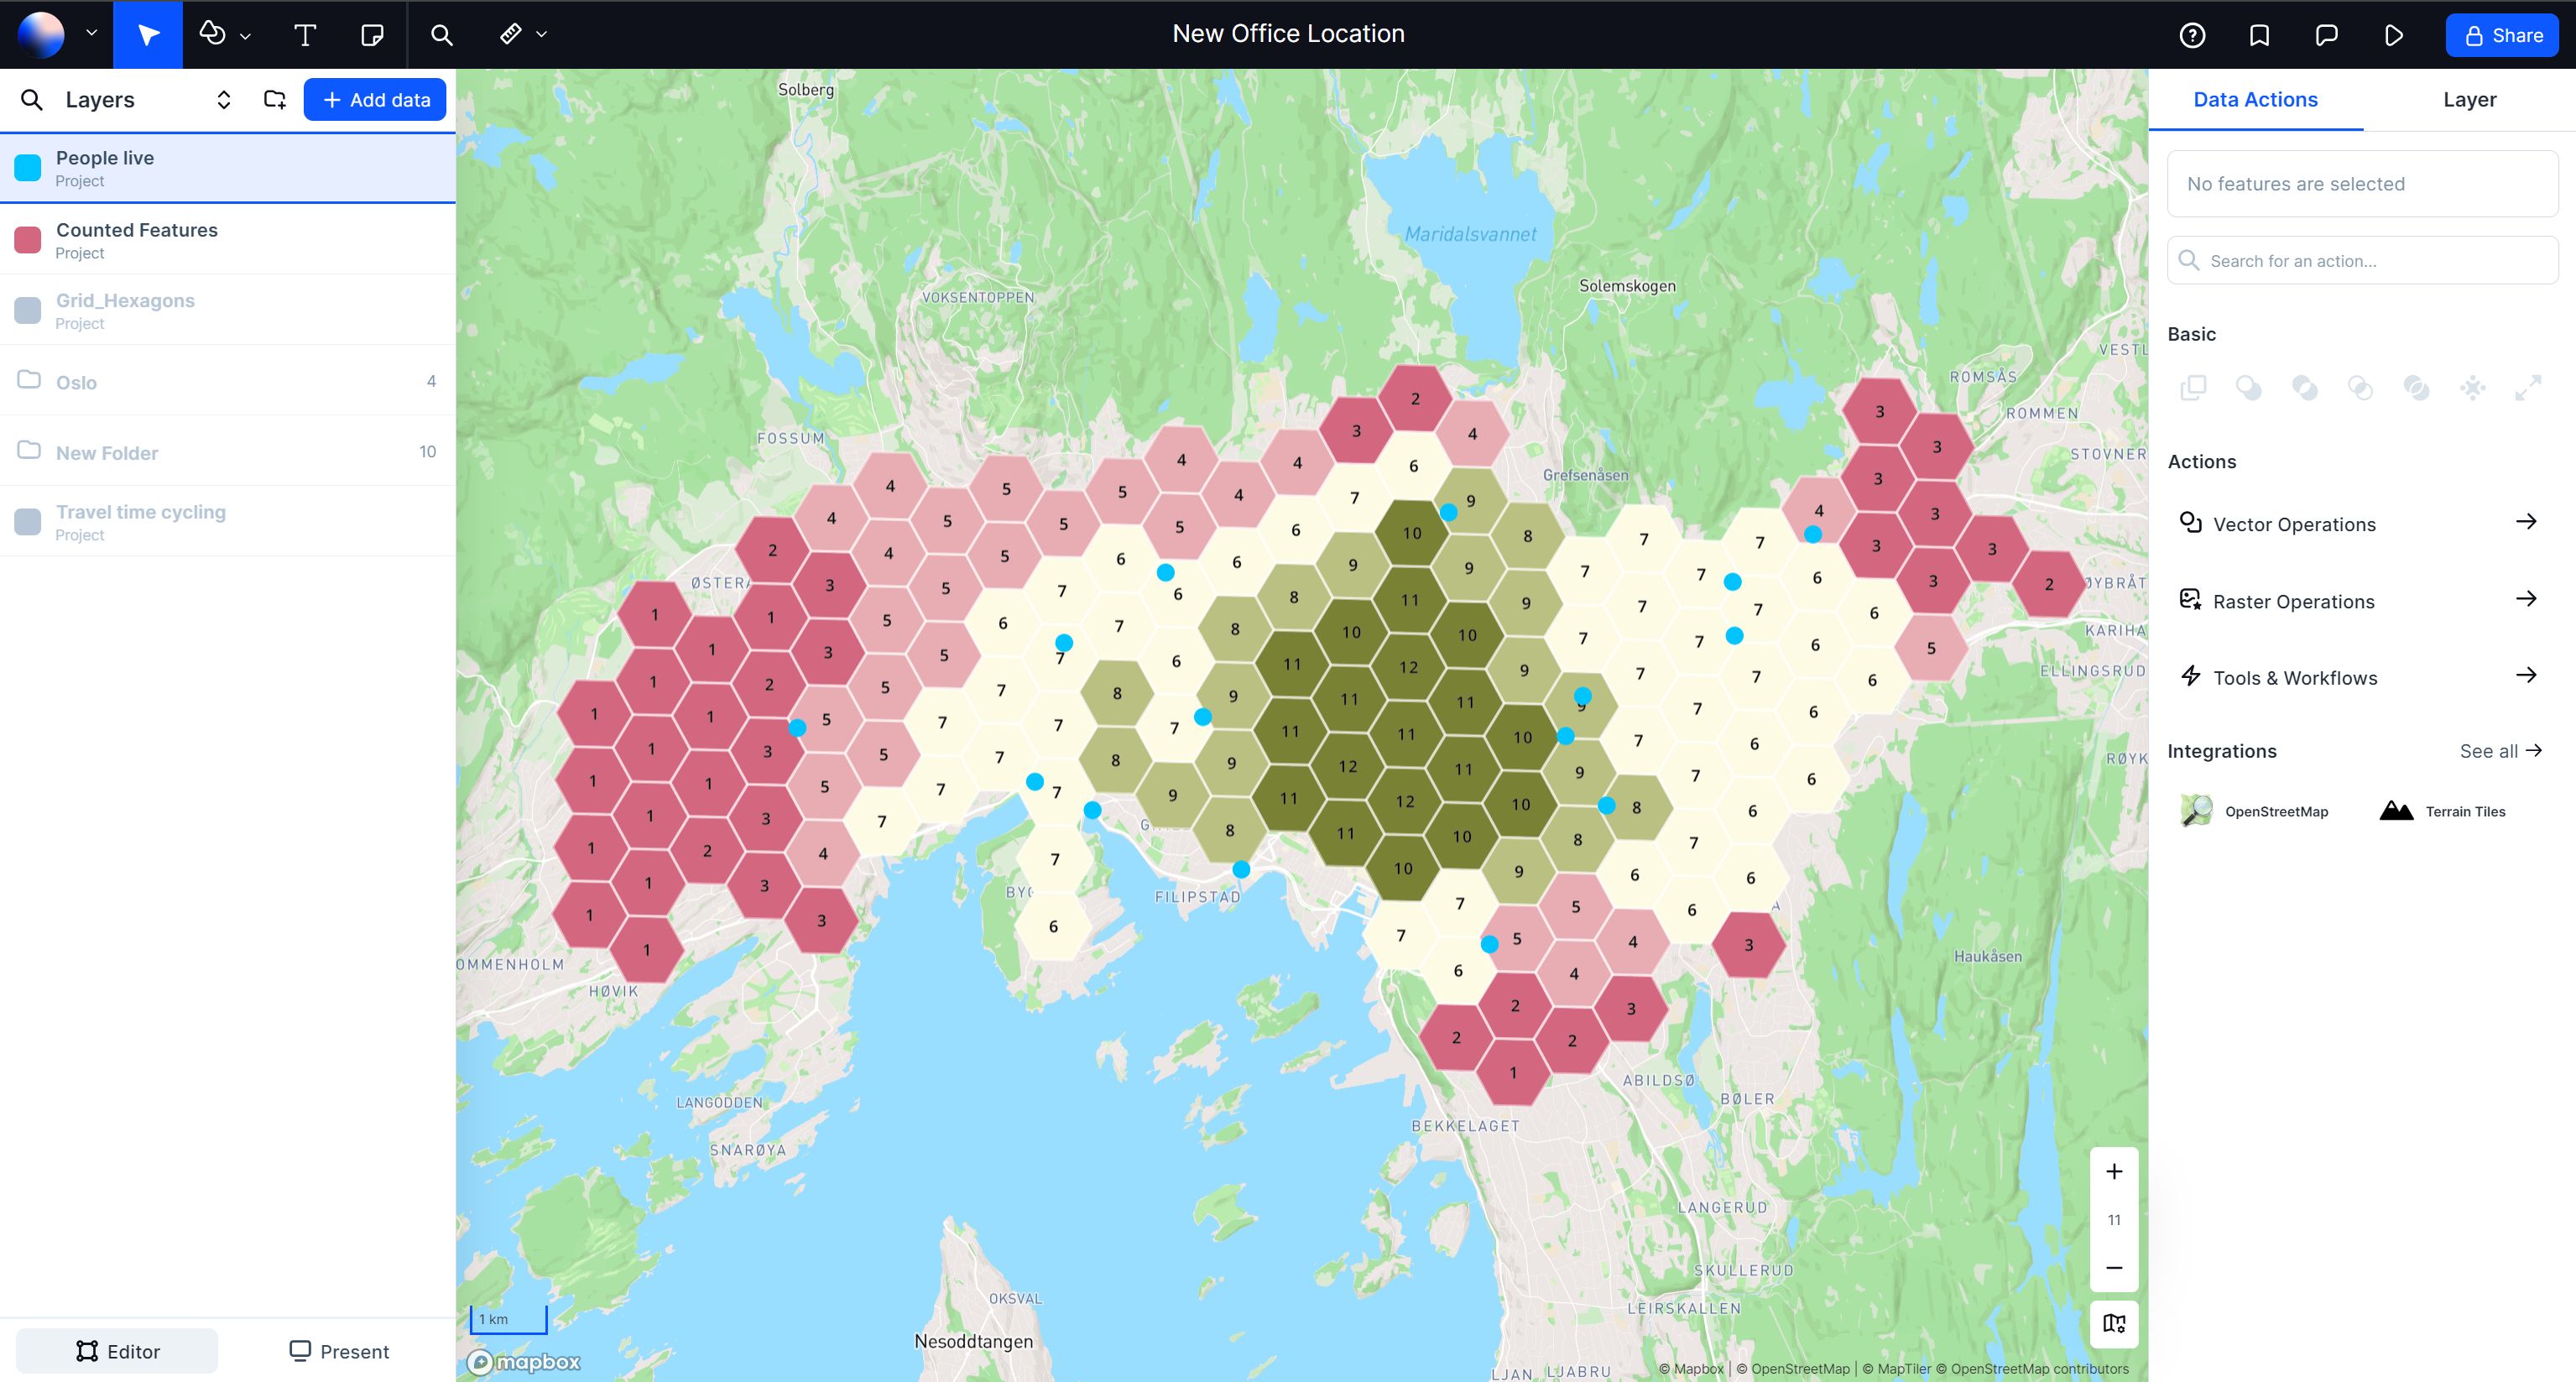
A 15-person company in Oslo evaluated where to relocate for employees to reach the office in 20 minutes by cycle.
3. Evaluating real estate investments
The geospatial team at a property consultancy firm utilizes travel time data to enhance their understanding of journey durations across various transportation modes, including public transit. This data allows the team to evaluate the potential investment value of properties.
For instance, the visualization below depicts travel time catchment areas surrounding several sites, both by driving and public transportation.
By analyzing the variance in these catchment areas, it becomes feasible to pinpoint the optimal investment location for specific real estate types, such as a new office or retail space.
4. Choosing the right store location
In the context of selecting a new store location, leveraging travel time data enables retailers to pinpoint areas with optimal accessibility for customers.
For instance, utilizing tools like the Travel Time add-on allows the calculation of catchment areas for public transport, driving, and walking from any given location.
When combined with demographic data, analysis of the reachable population within specific areas becomes possible. These insights then inform the selection of the most suitable store location.
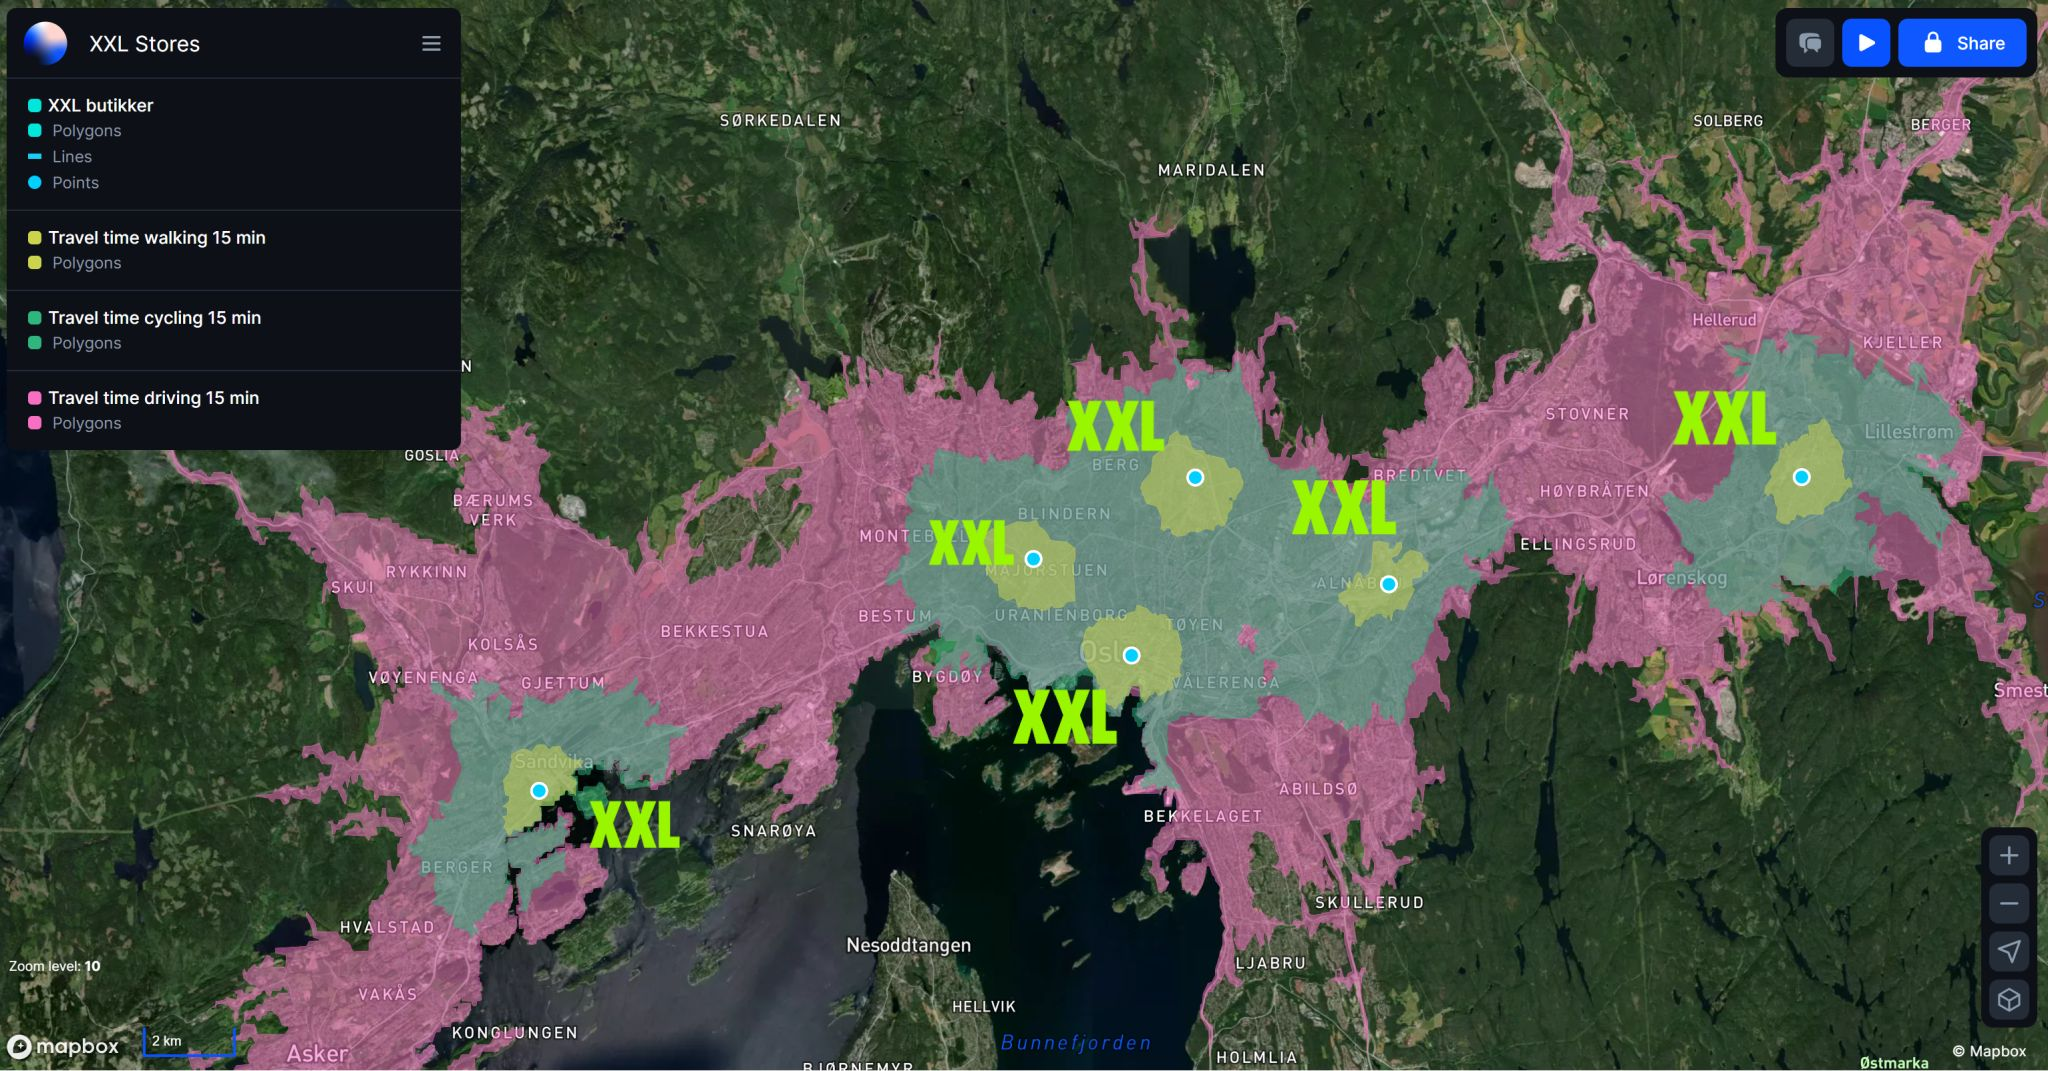
One of the top Sports Outlets in the Nordics evaluating catchment areas for different transportation modes.
5. Conducting a competitor analysis
Incorporating travel time data into your competitor analysis can yield valuable insights. For instance, determining that customers need to travel longer distances to reach a competitor's location might suggest the viability of expanding into that specific area.
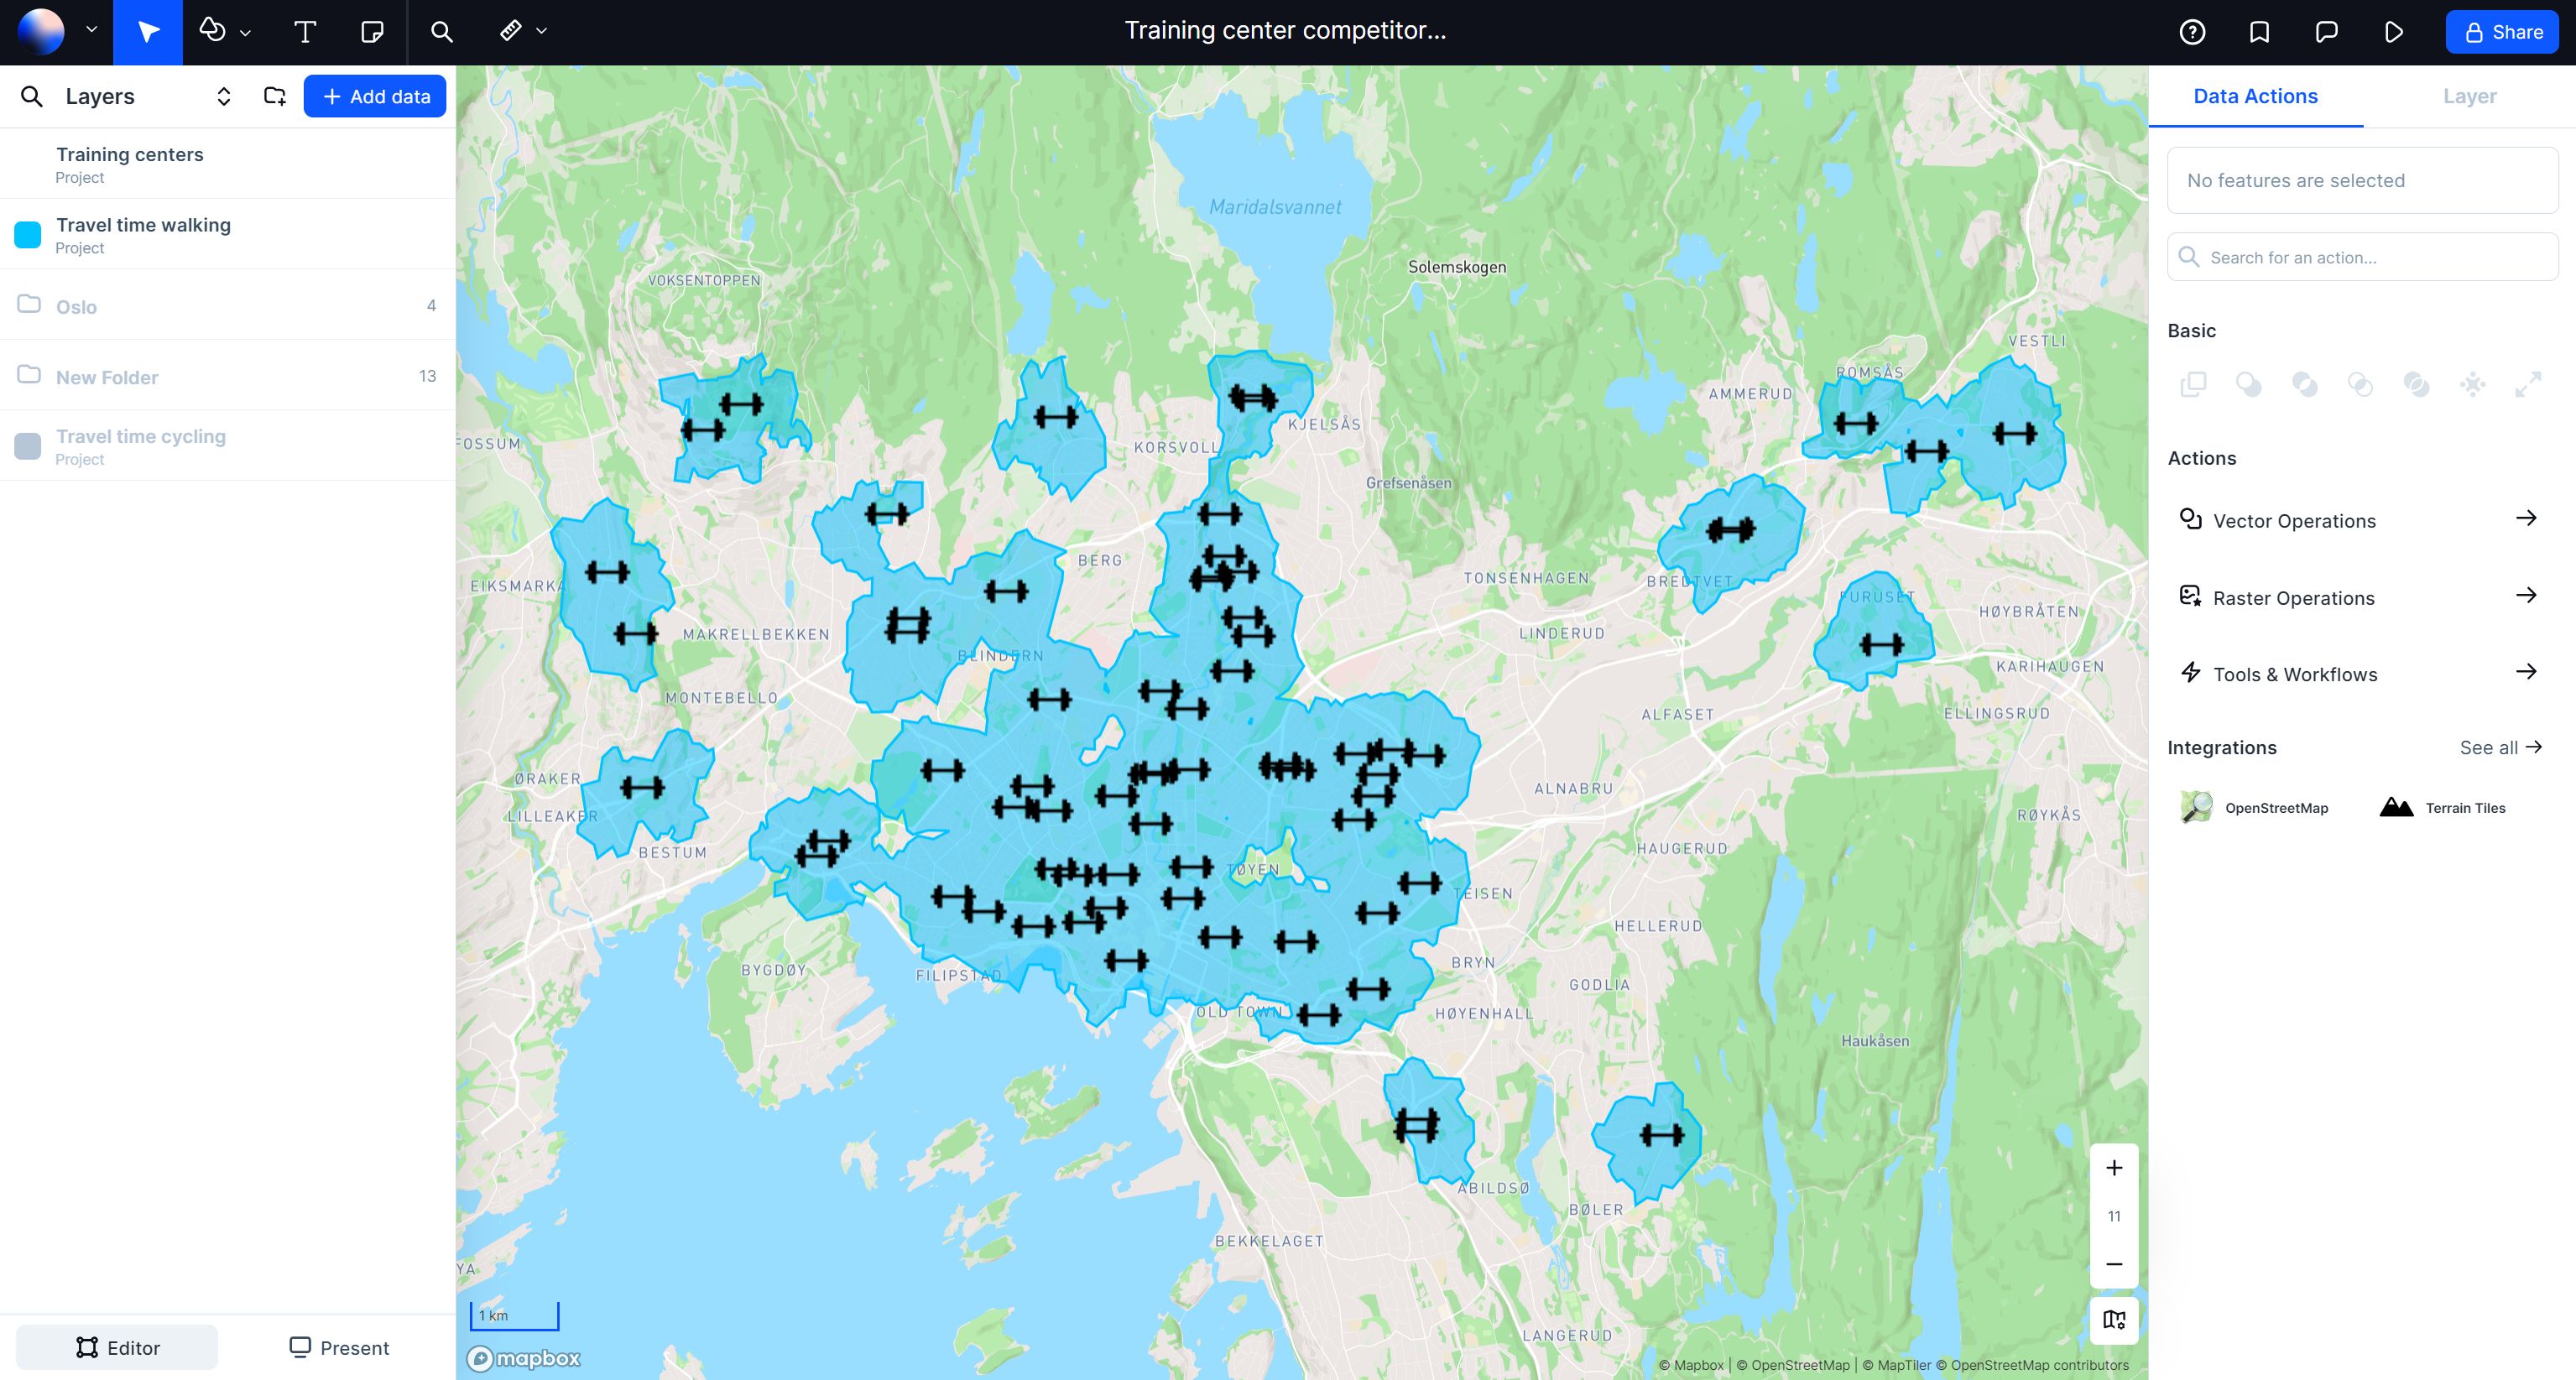
Training center looking at competitors and their catchment area of 10 min walking. competitors
6. Marketing and advertising
Marketing teams can leverage travel time data to enhance customer segmentation and targeting strategies.
For instance, a renowned furniture retailer's marketing team utilizes travel time data to analyze the distances customers travel to access specific store locations. This data informs the segmentation of customers and enables the creation of customized marketing campaigns.
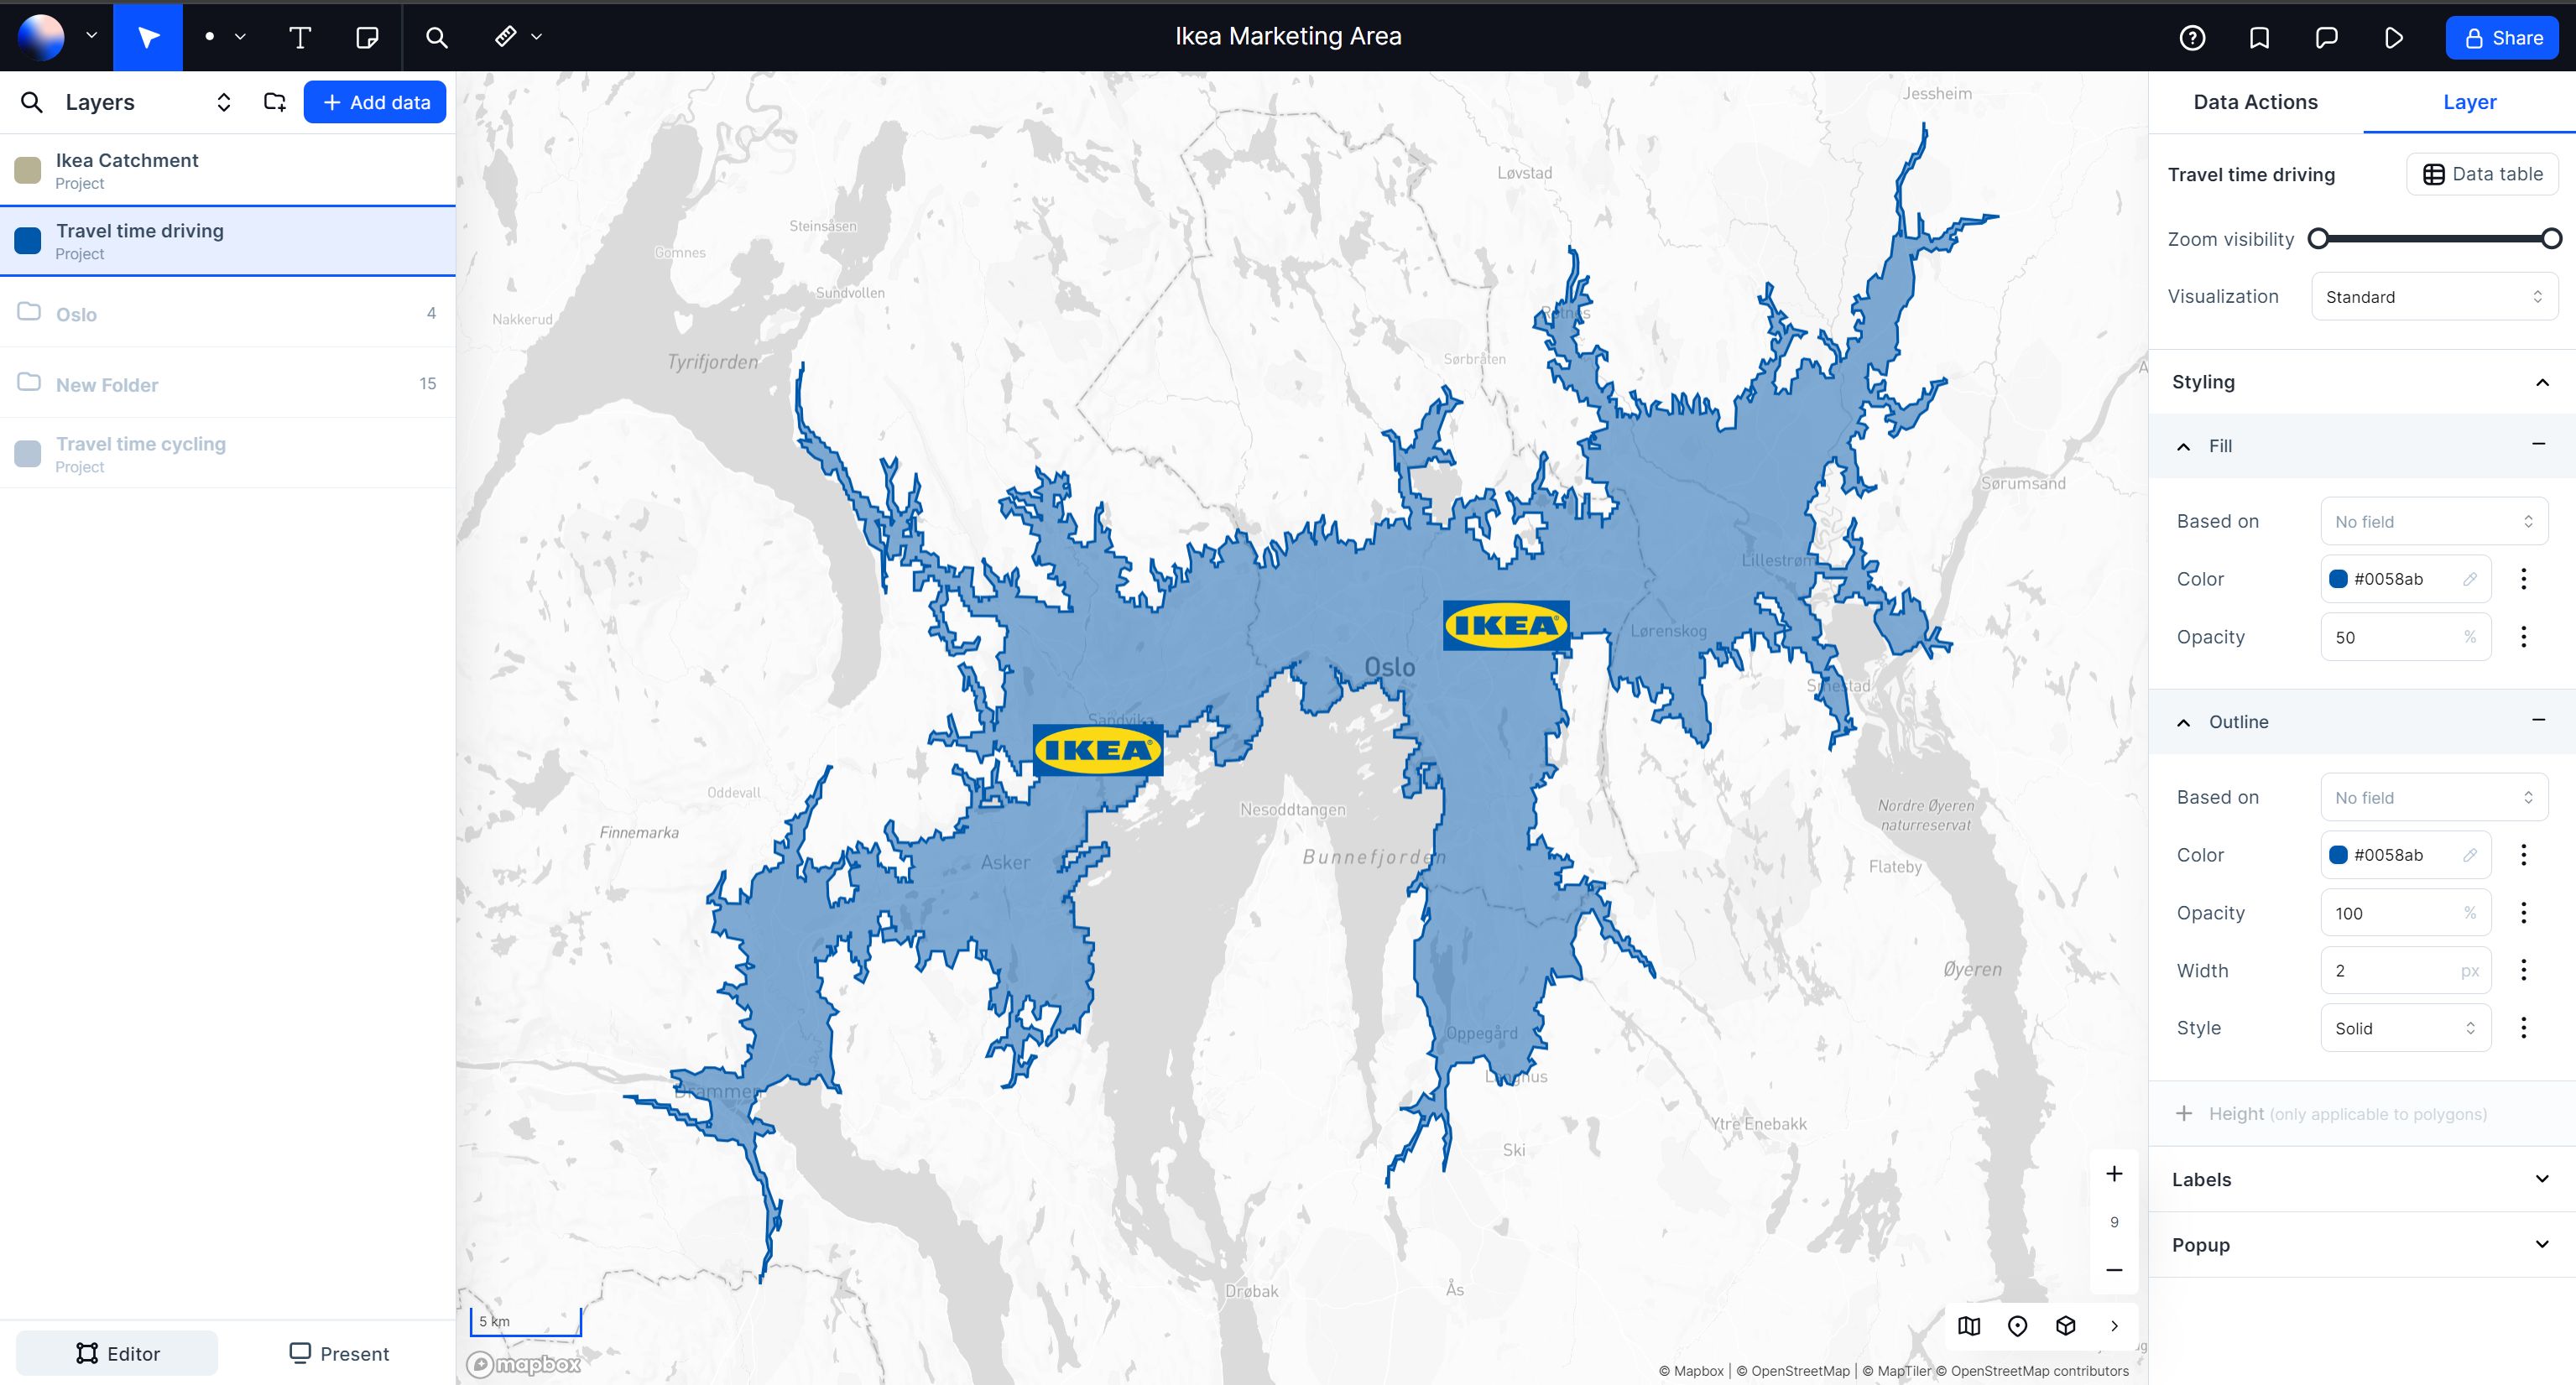
A drive-time map is employed to develop focused advertising campaigns utilizing customer location data.
7. Comparing accessibility by different transport modes
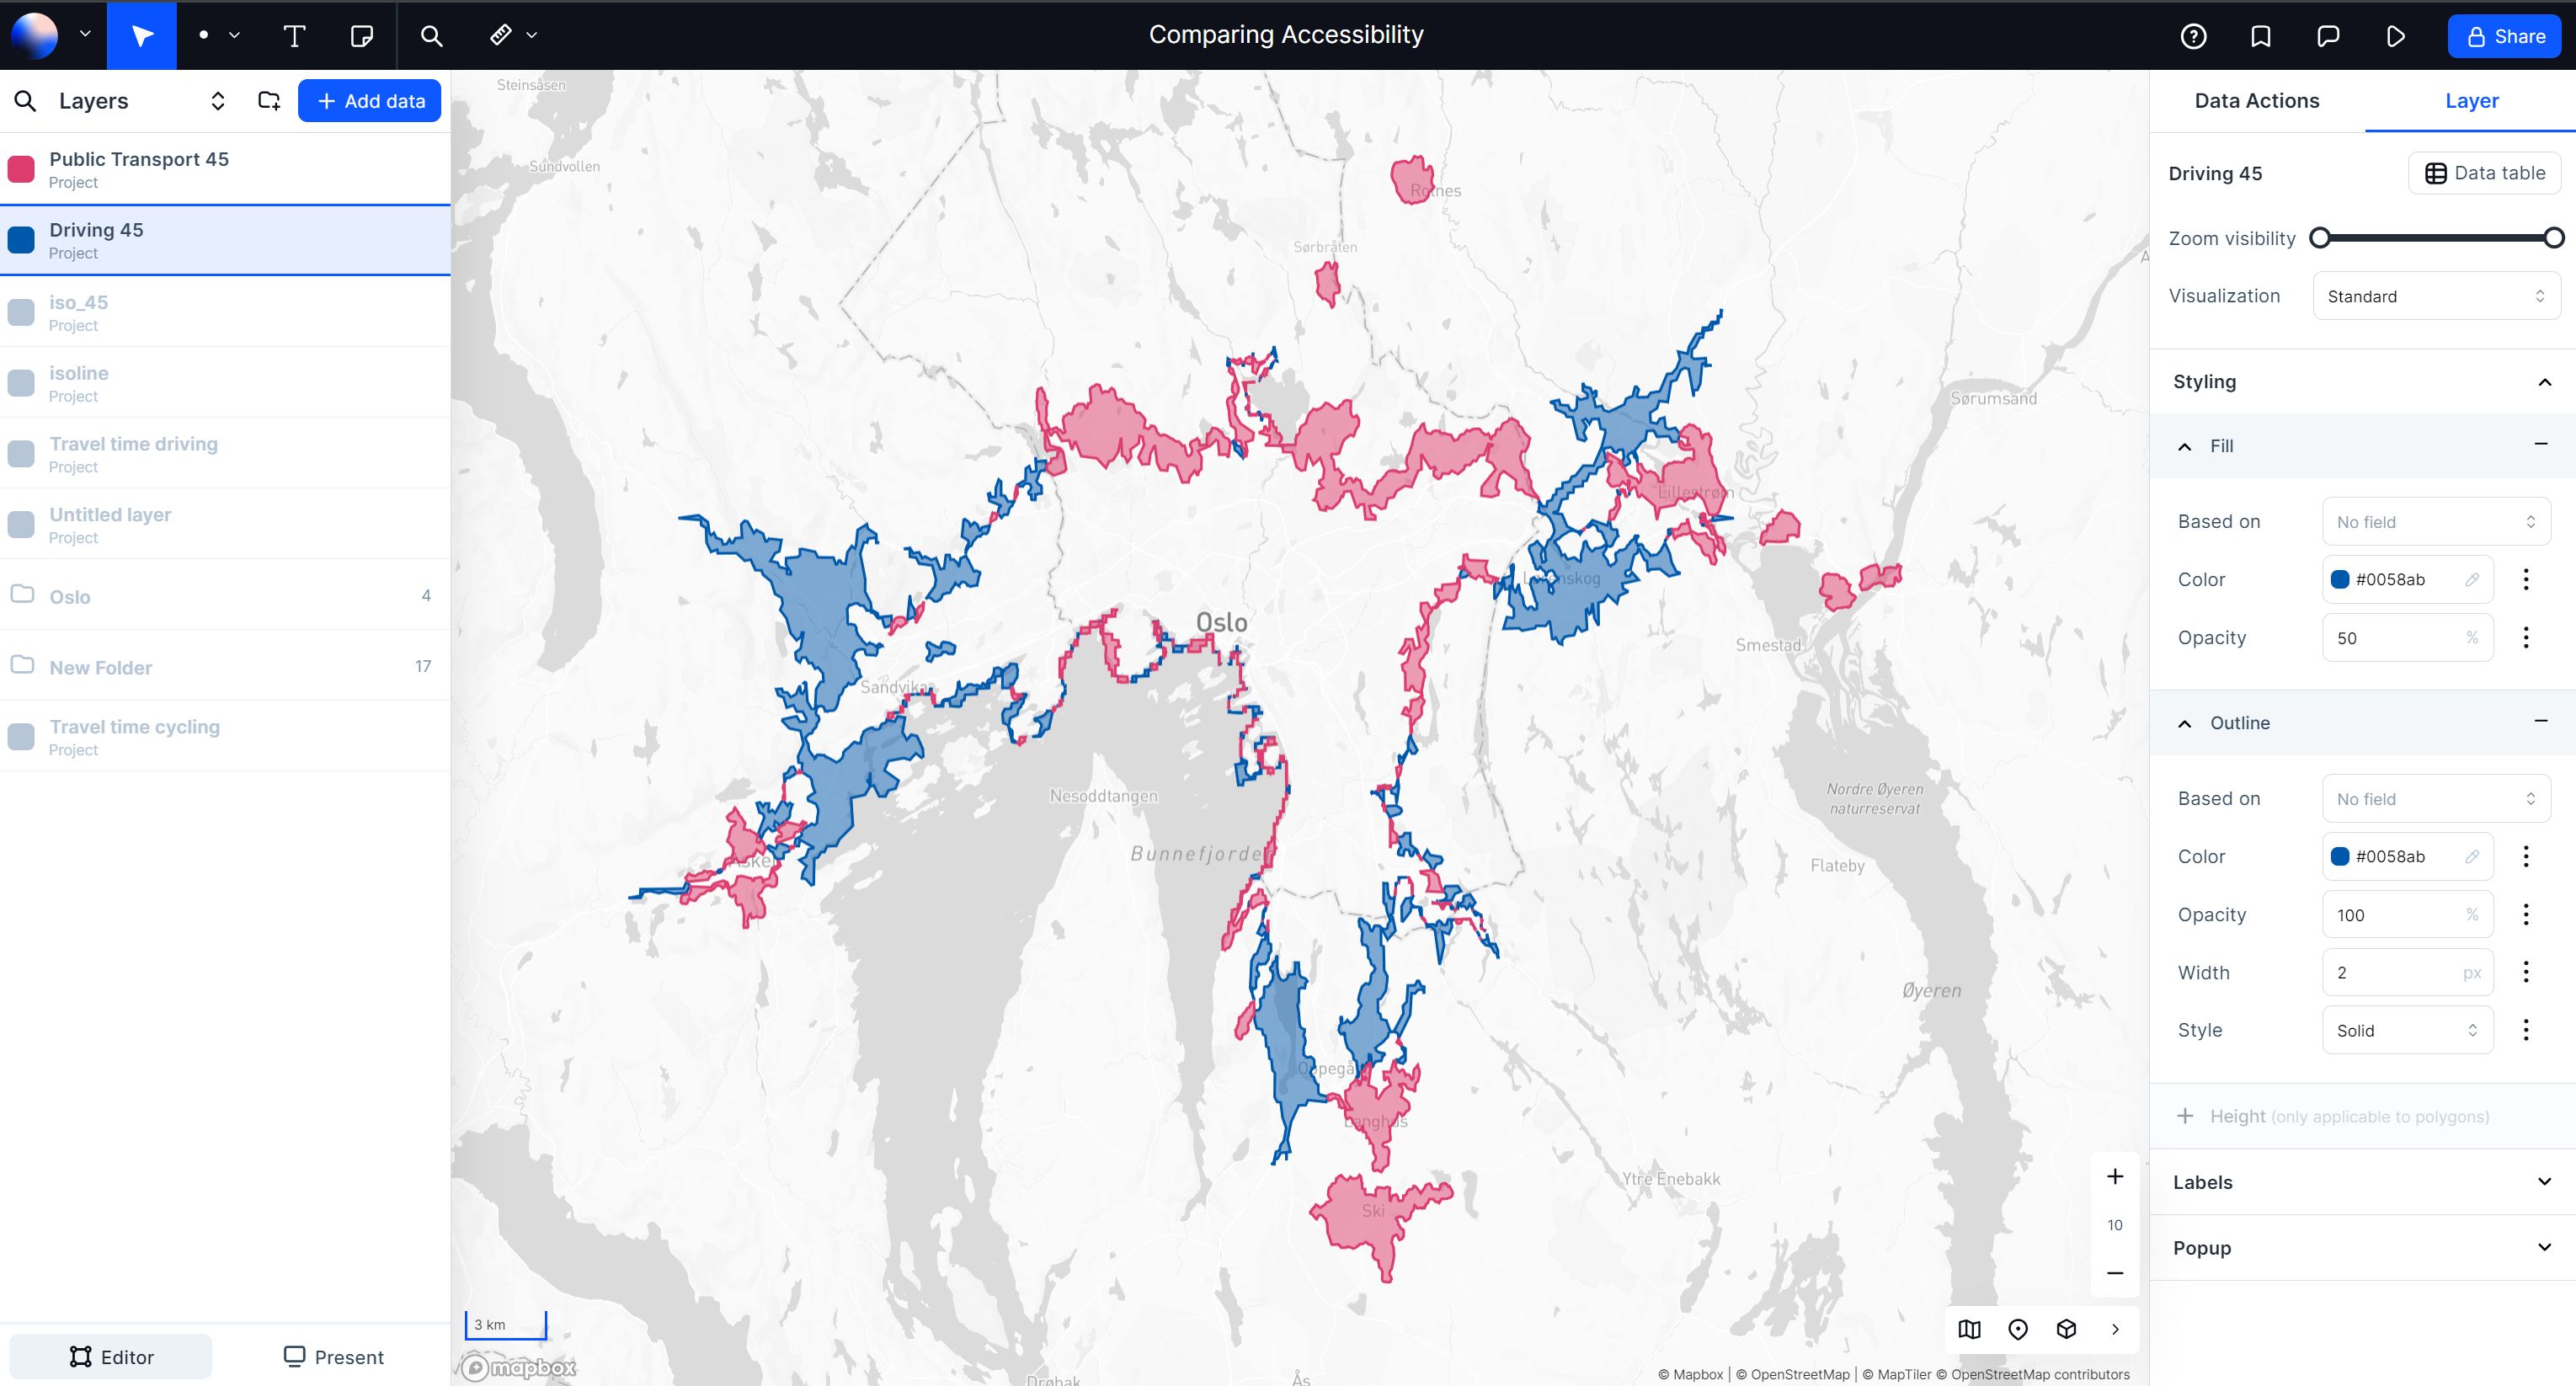
Incorporating public transport data into accessibility studies provides further depth, enabling the creation of catchment areas depicting all accessible destinations within a specified time frame from a given starting point, utilizing various modes of public transportation.
For instance, the visualization below delineates disparities between driving and public transport catchment areas.
The red areas indicate destinations reachable within a 45-minutes journey by public transport but not by car. Conversely, the blue areas represent destinations reachable within a 45-minute drive but inaccessible via public transport.
8. Performing a public transport network analysis
Conducting a public transport network analysis proves particularly beneficial for infrastructure planning purposes. For instance, generating public transport catchment areas facilitates the identification of public transport black spots necessitating the establishment of new routes.
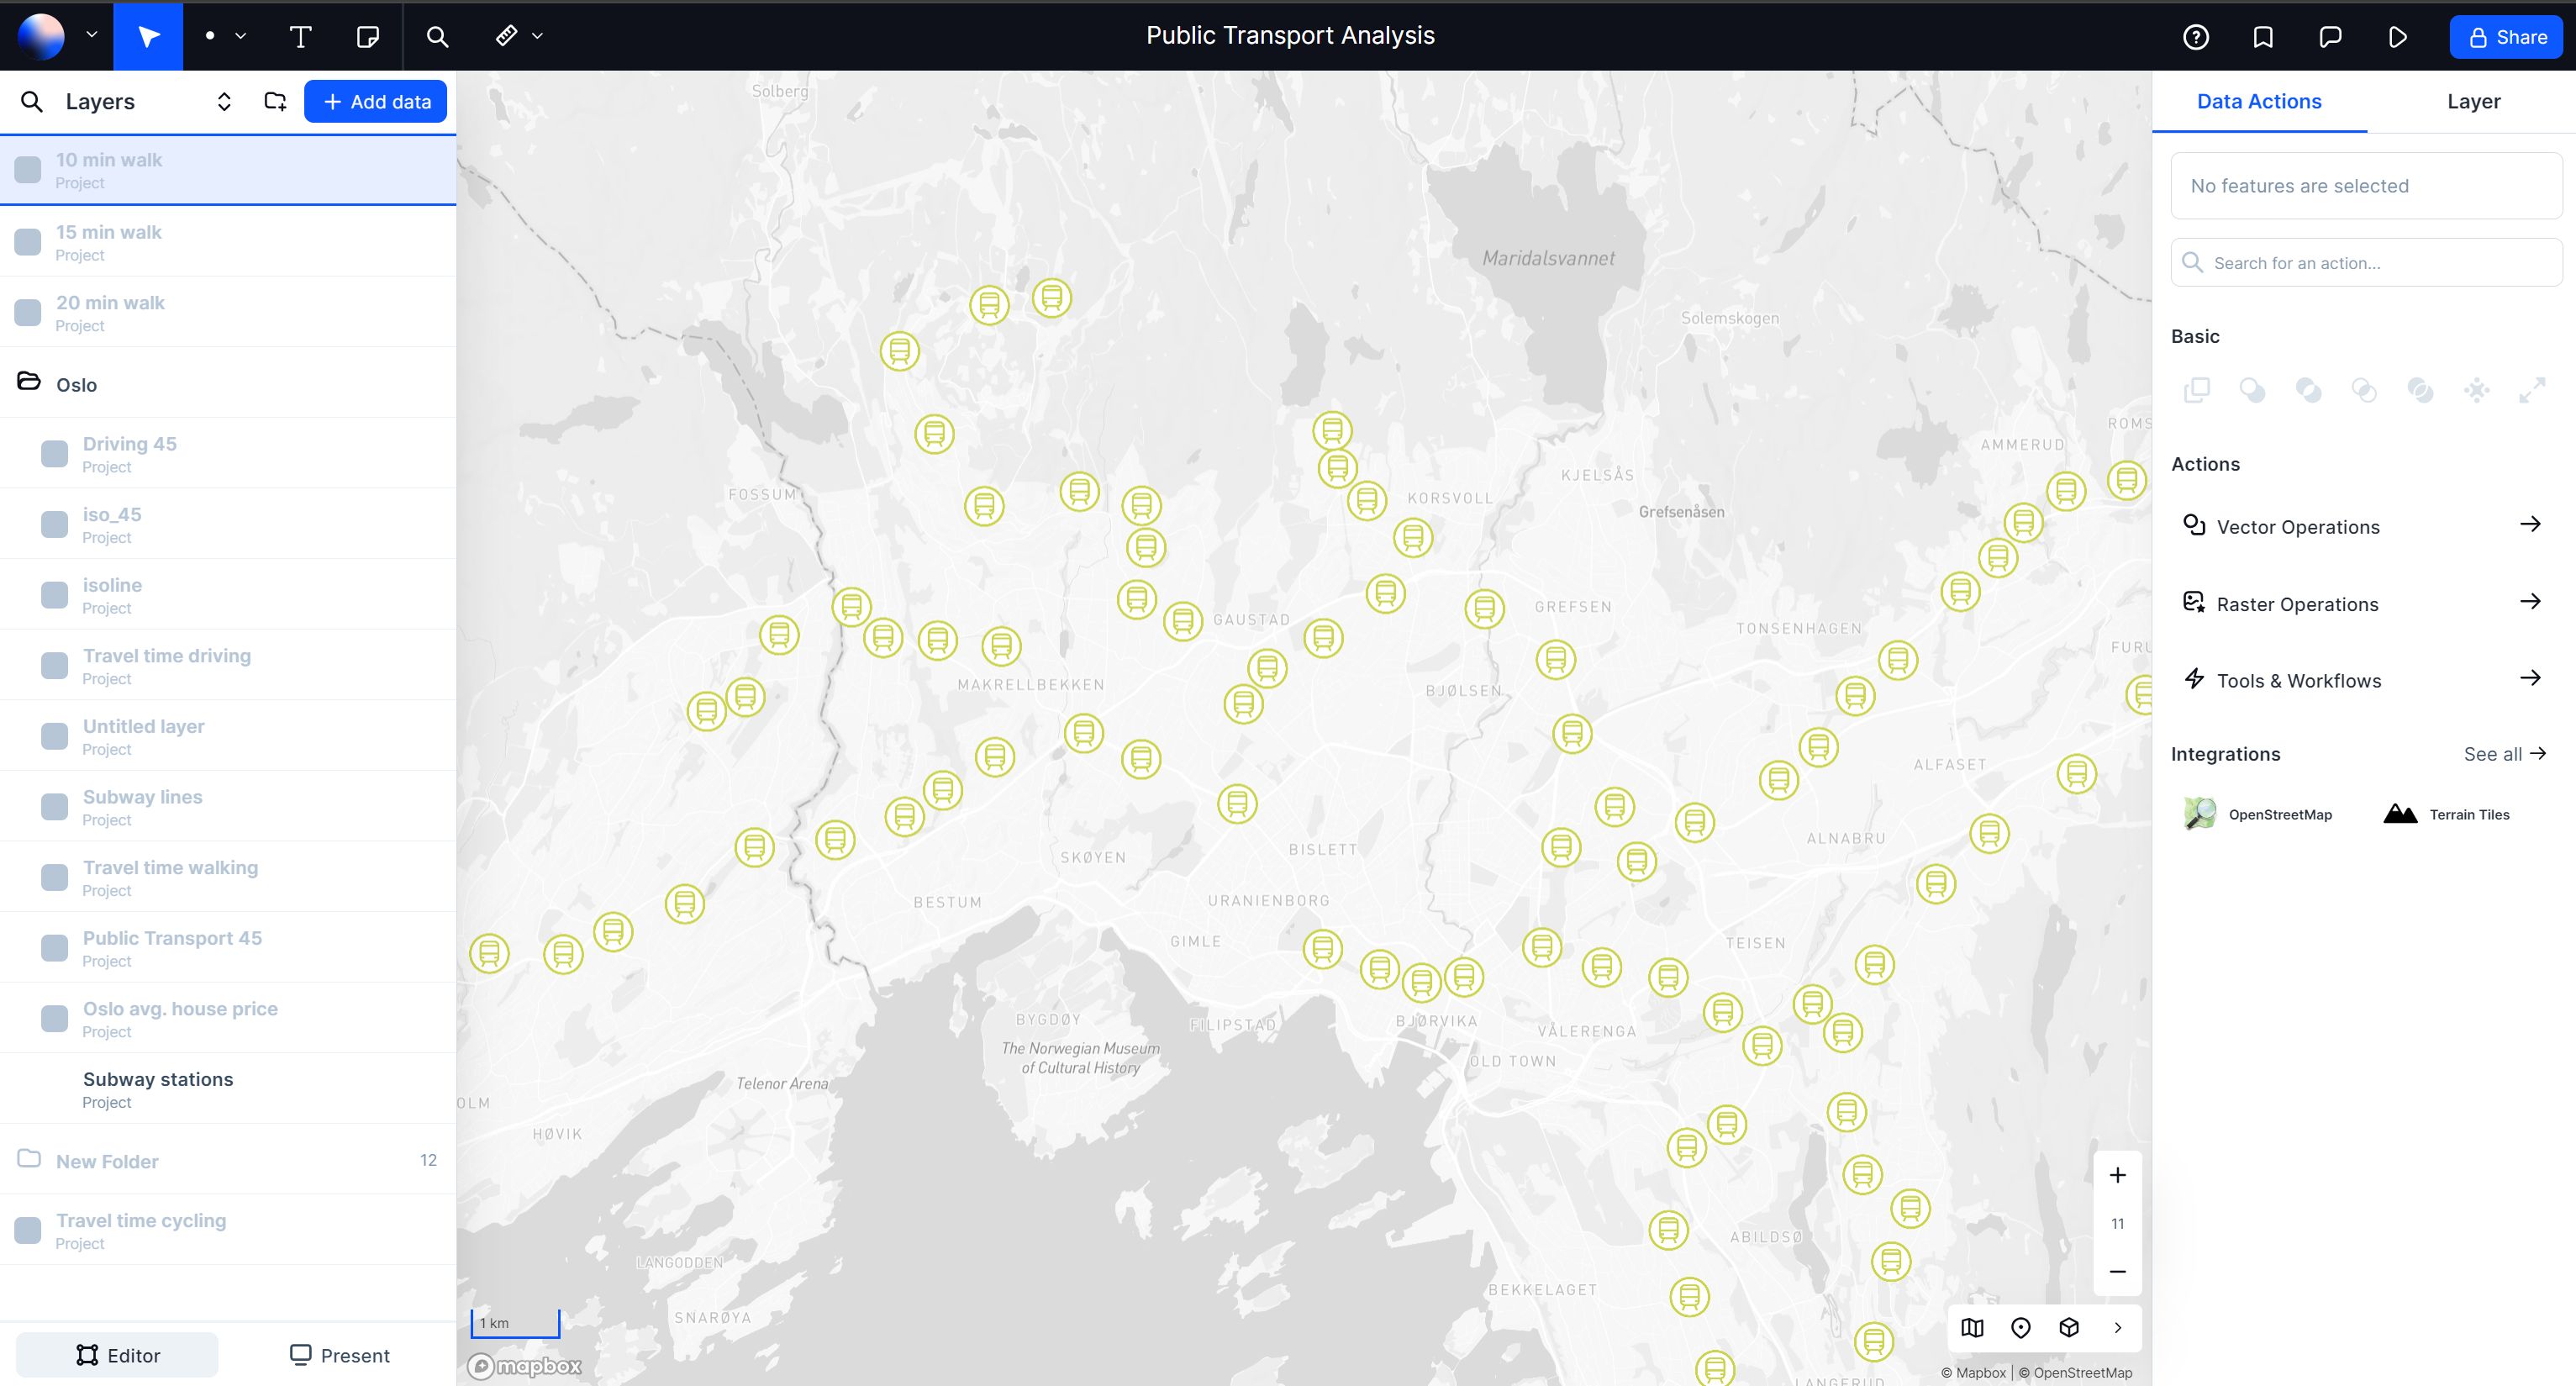
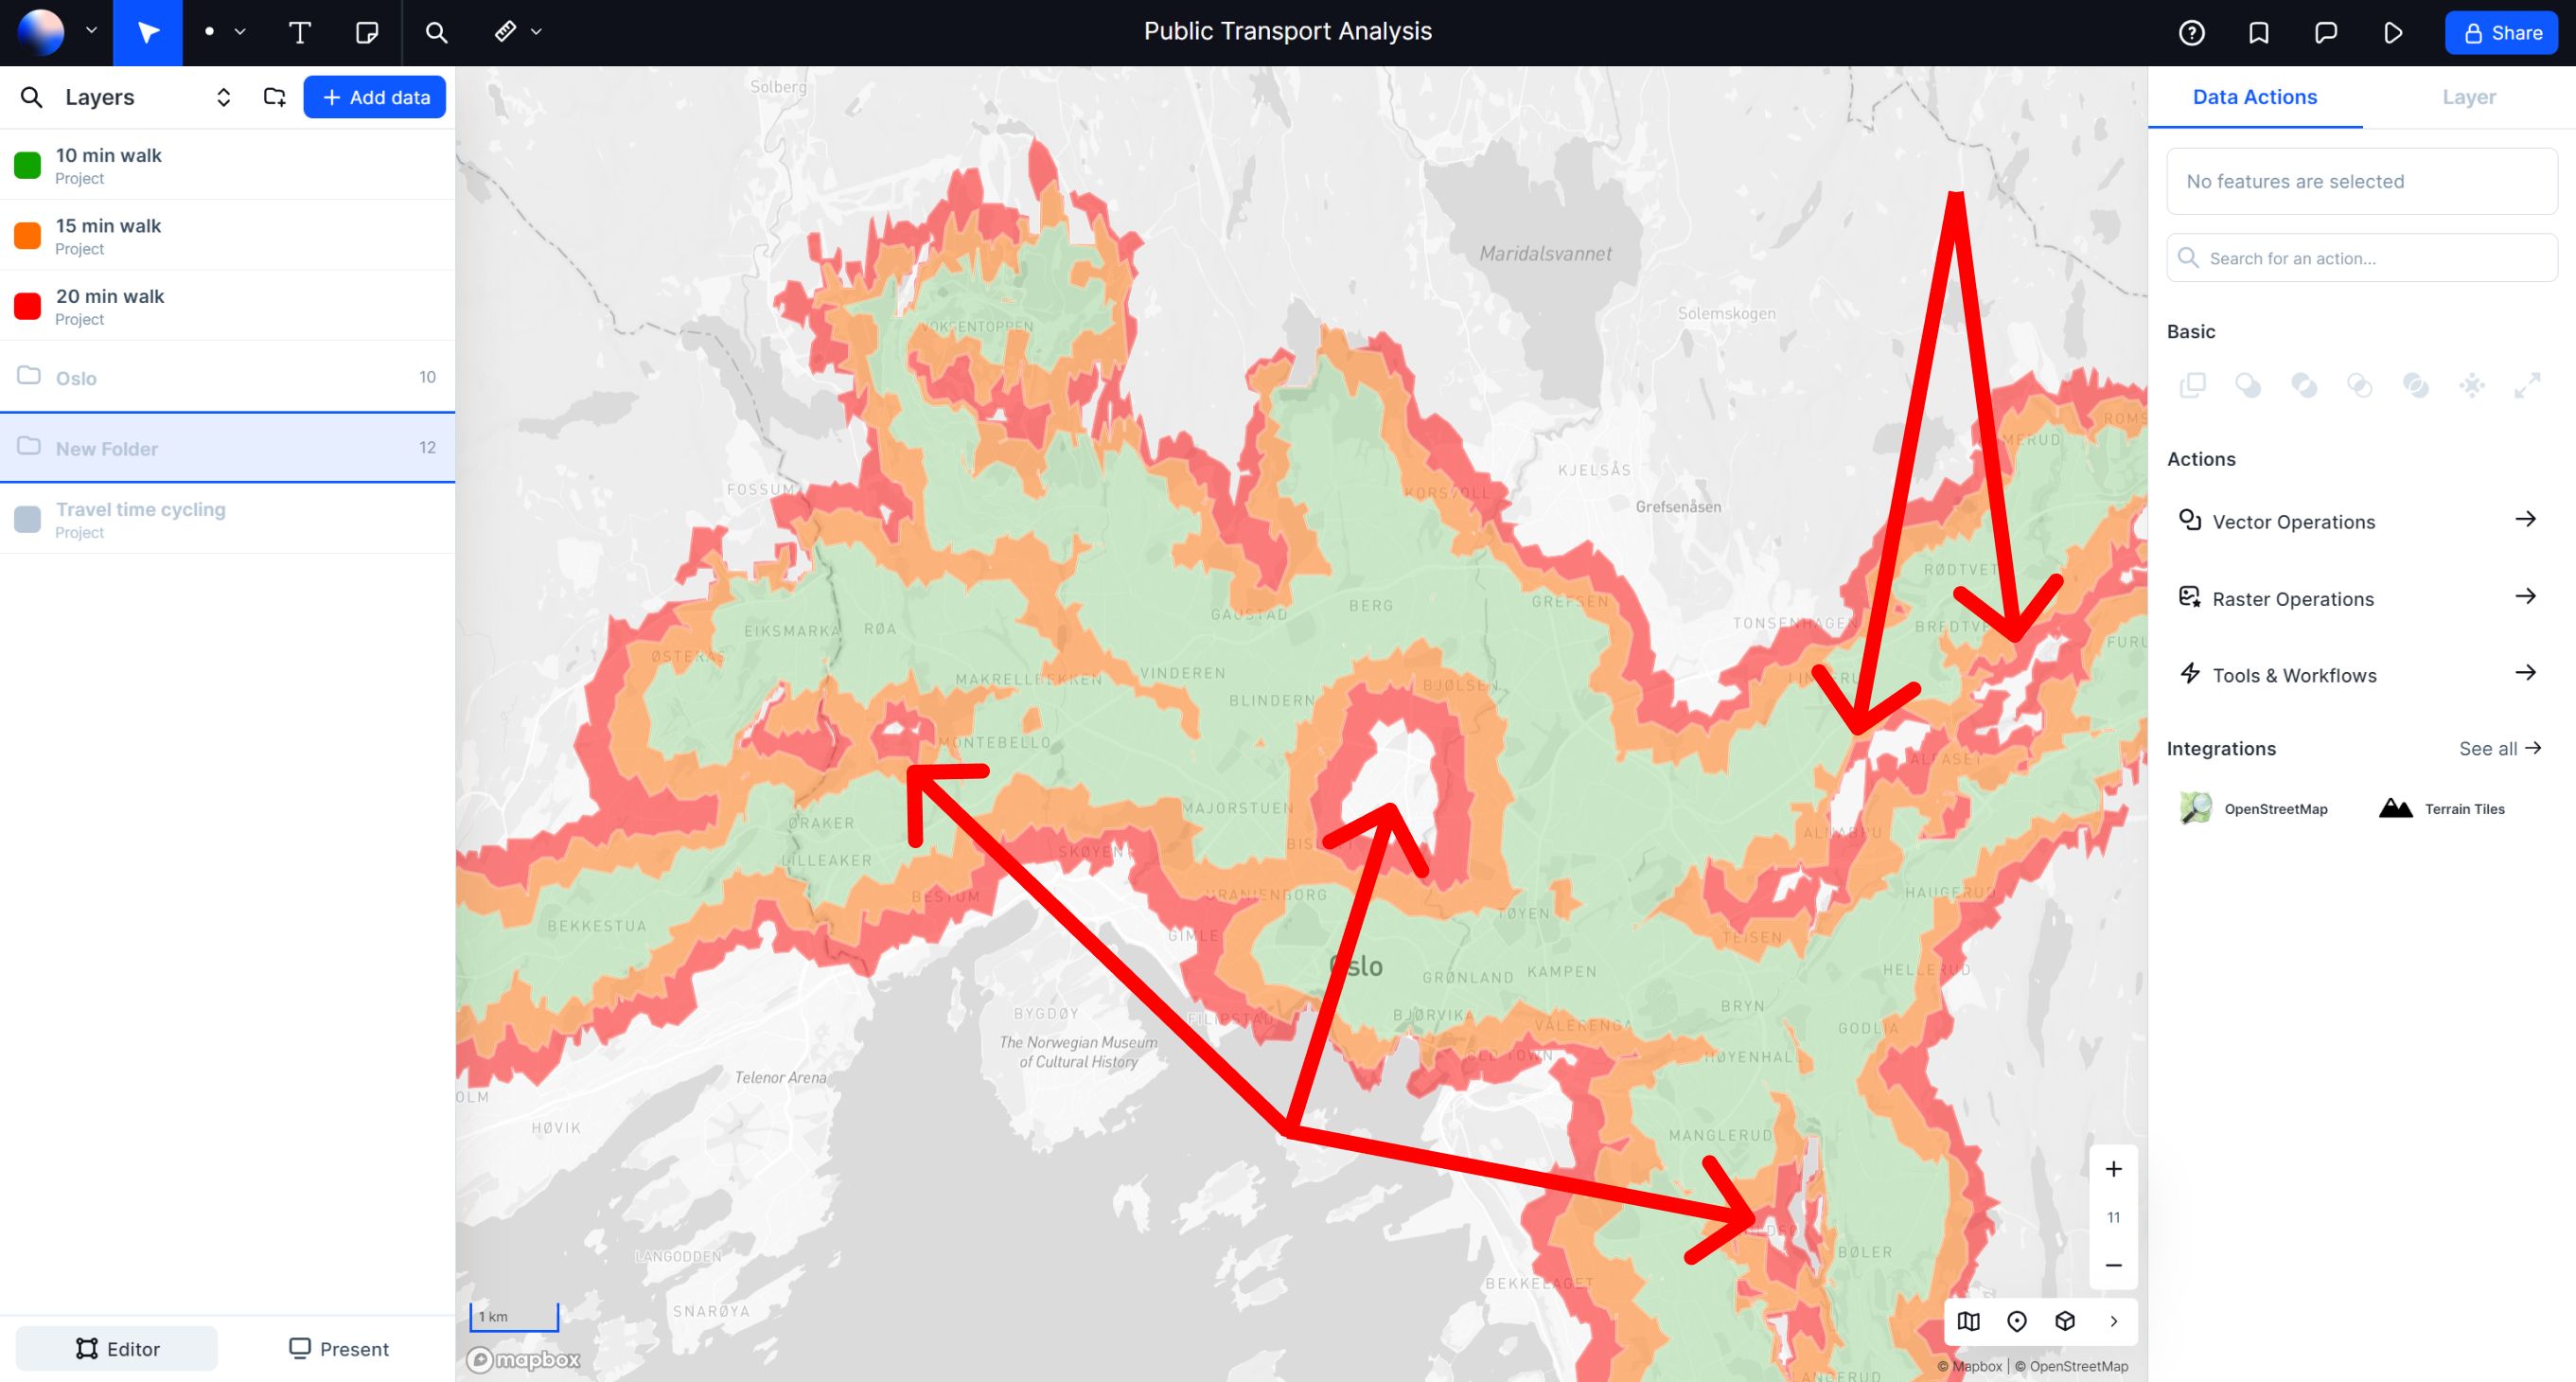
In the aforementioned example, stations from the Oslo rail network have been utilized to establish 10-minute, 20-minute, and 30-minute walking catchment areas around each station. This approach enables the identification of areas currently lacking service from the rail network.
Conclusion: Enrich your location analysis with travel time data
Integrating travel time data into your location analysis opens up numerous possibilities for gaining deeper insights and improving decision-making processes.
The examples provided here offer just a glimpse into the myriad ways travel time data can enrich your location analysis. However, the potential applications are virtually limitless.
If you're eager to embark on travel time analysis, the Travel Time Analysis in Atlas provides a seamless way to integrate travel time data into your geospatial analysis workflow.
Begin your journey by signing up for a starter license (free). With this tool, you can effortlessly create travel time catchment areas, analyze journey times, and explore a host of other functionalities to enhance your spatial analysis endeavors.
![Travel Time Analysis [Complete Guide + 8 Examples]](https://atlas.co/images/posts/travel-time-analysis-hero.png)
