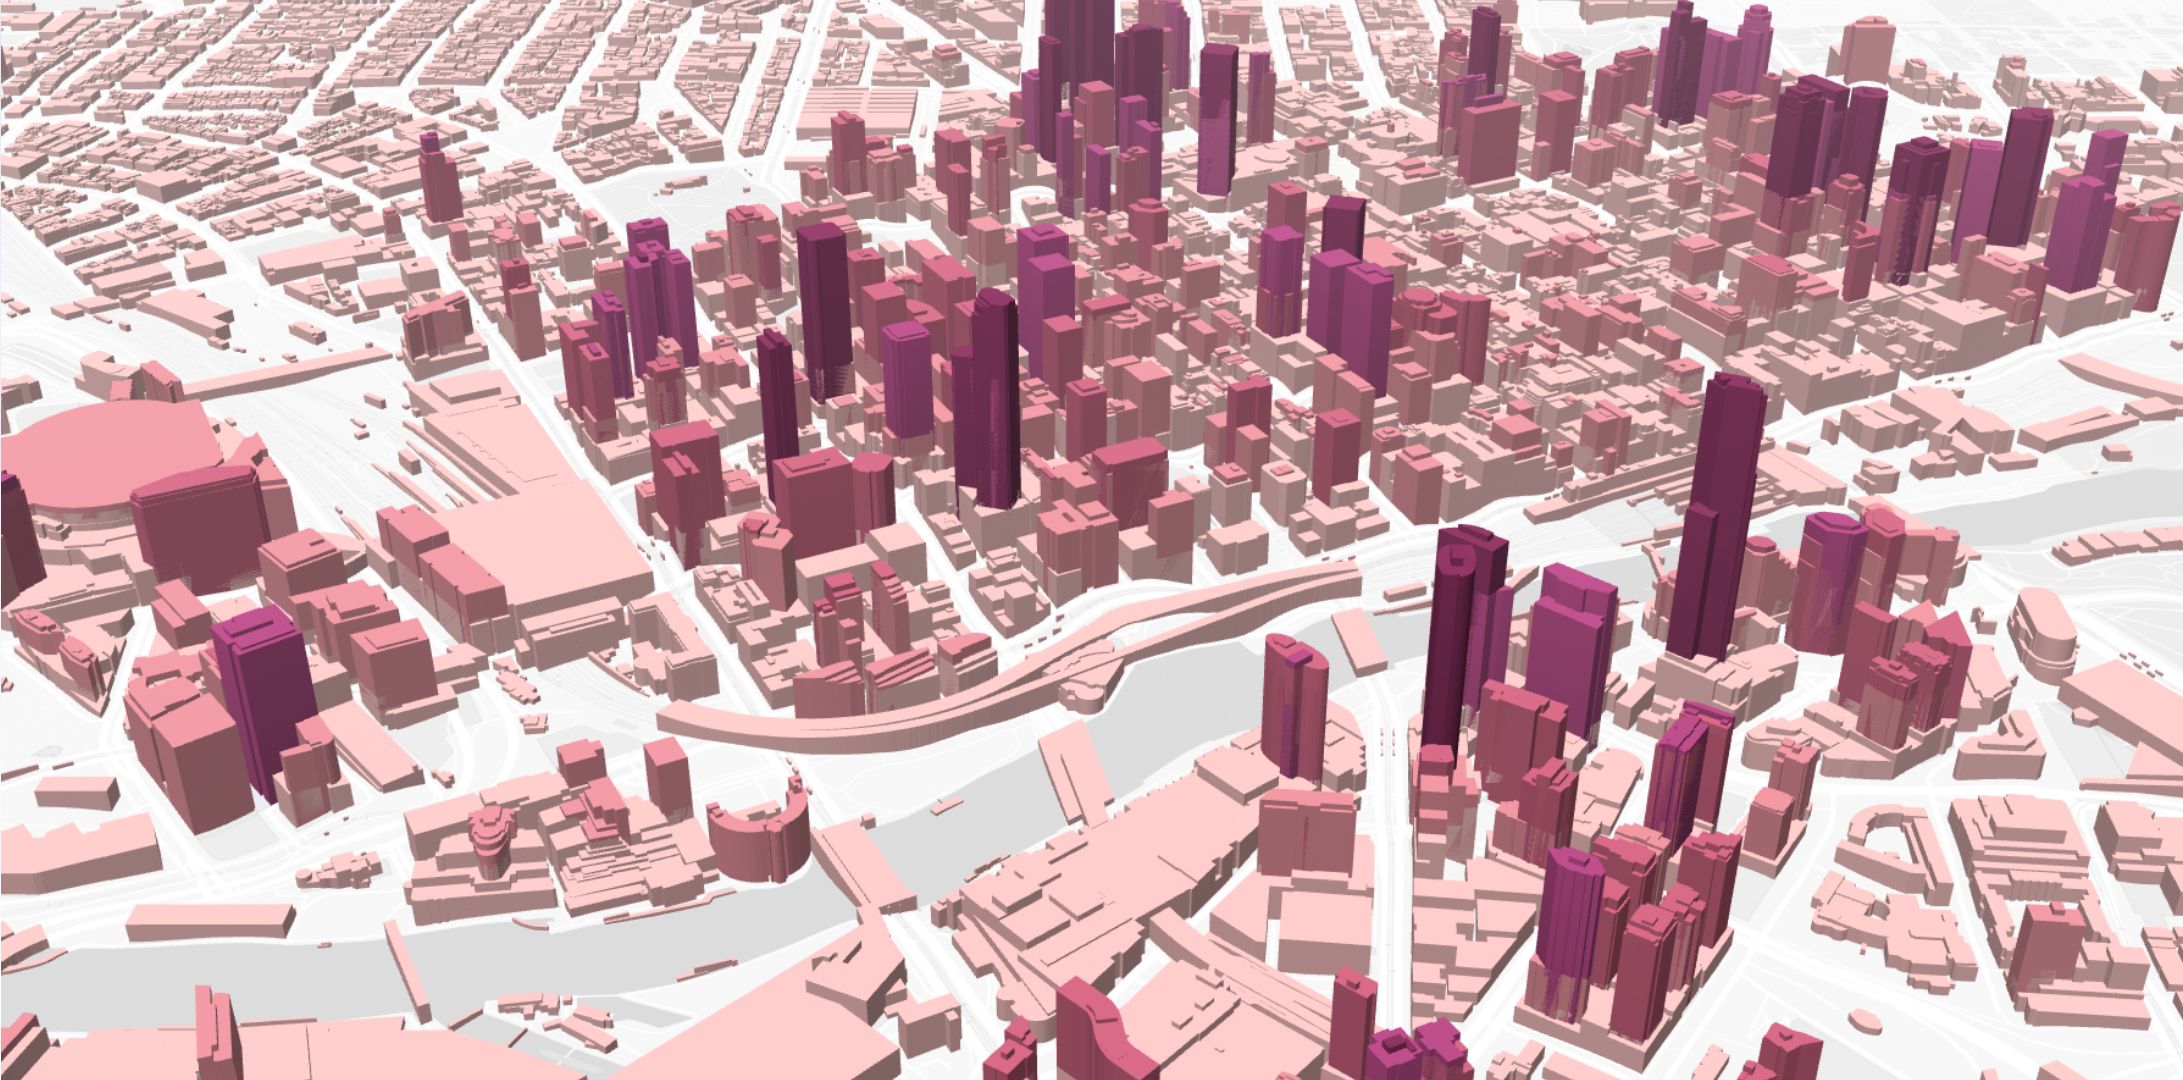
Maps are everywhere.
From planning your next road trip to analyzing complex data, maps help us make sense of the world.
Creating your own maps has never been easier. With modern tools, anyone can create stunning visualizations without being a GIS expert. Whether you’re a researcher, marketer, or student, there’s a tool out there for you.
Here are some of the top map maker tools you should know about.
1. Atlas
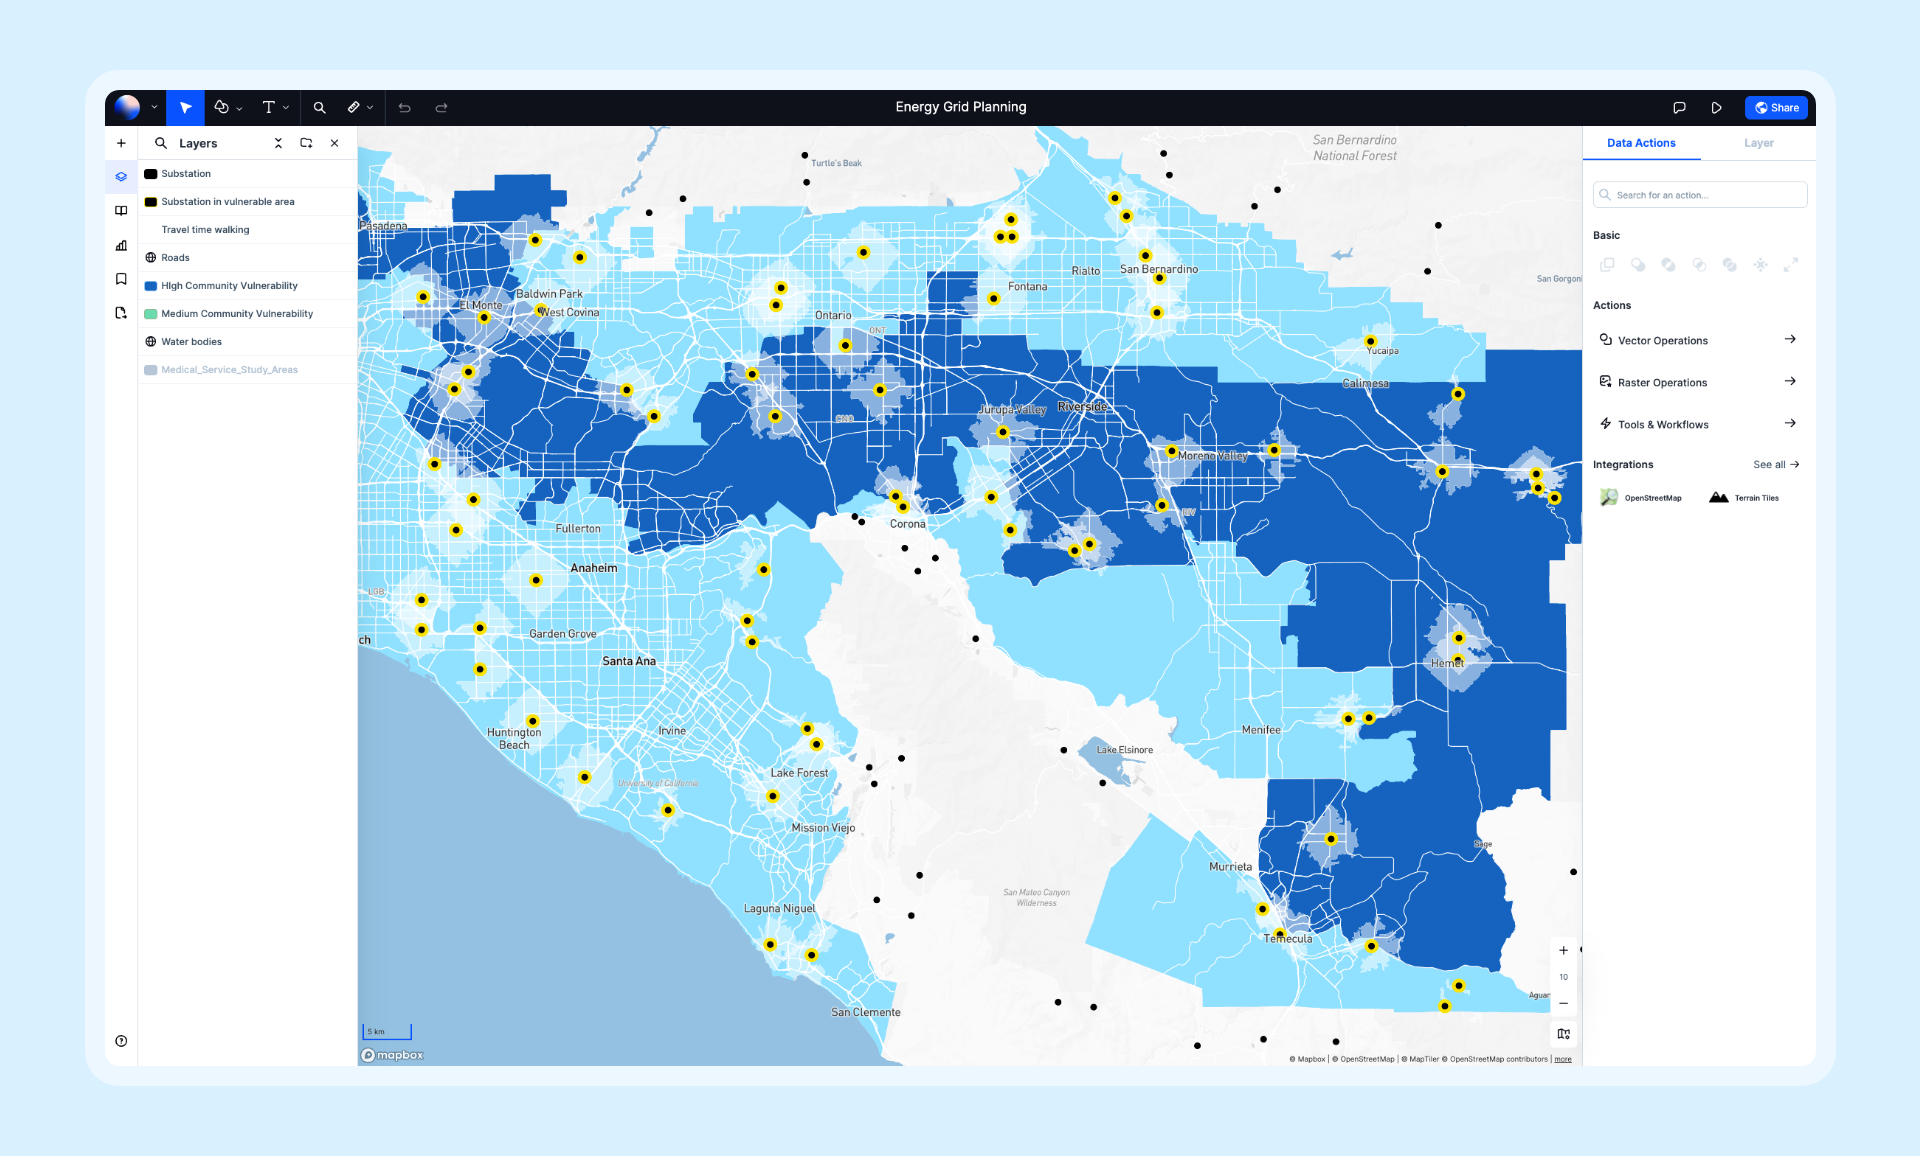
Atlas is a browser-based GIS platform designed for simplicity and power.
You don’t need to download anything. Open it in your browser, and you’re ready to create maps.
Atlas makes it easy to visualize data. Import your spreadsheets, drag and drop, and see your data on a map instantly. Its clean interface means you won’t get overwhelmed with features you don’t need.
Why Choose Atlas?
- No installation: Everything works online.
- User-friendly: Great for beginners.
- Customizable visuals: Choose colors, labels, and styles to match your needs.
- Sign up: Atlas
Atlas is perfect for quick, professional-looking maps without the steep learning curve.
2. Google Maps Platform
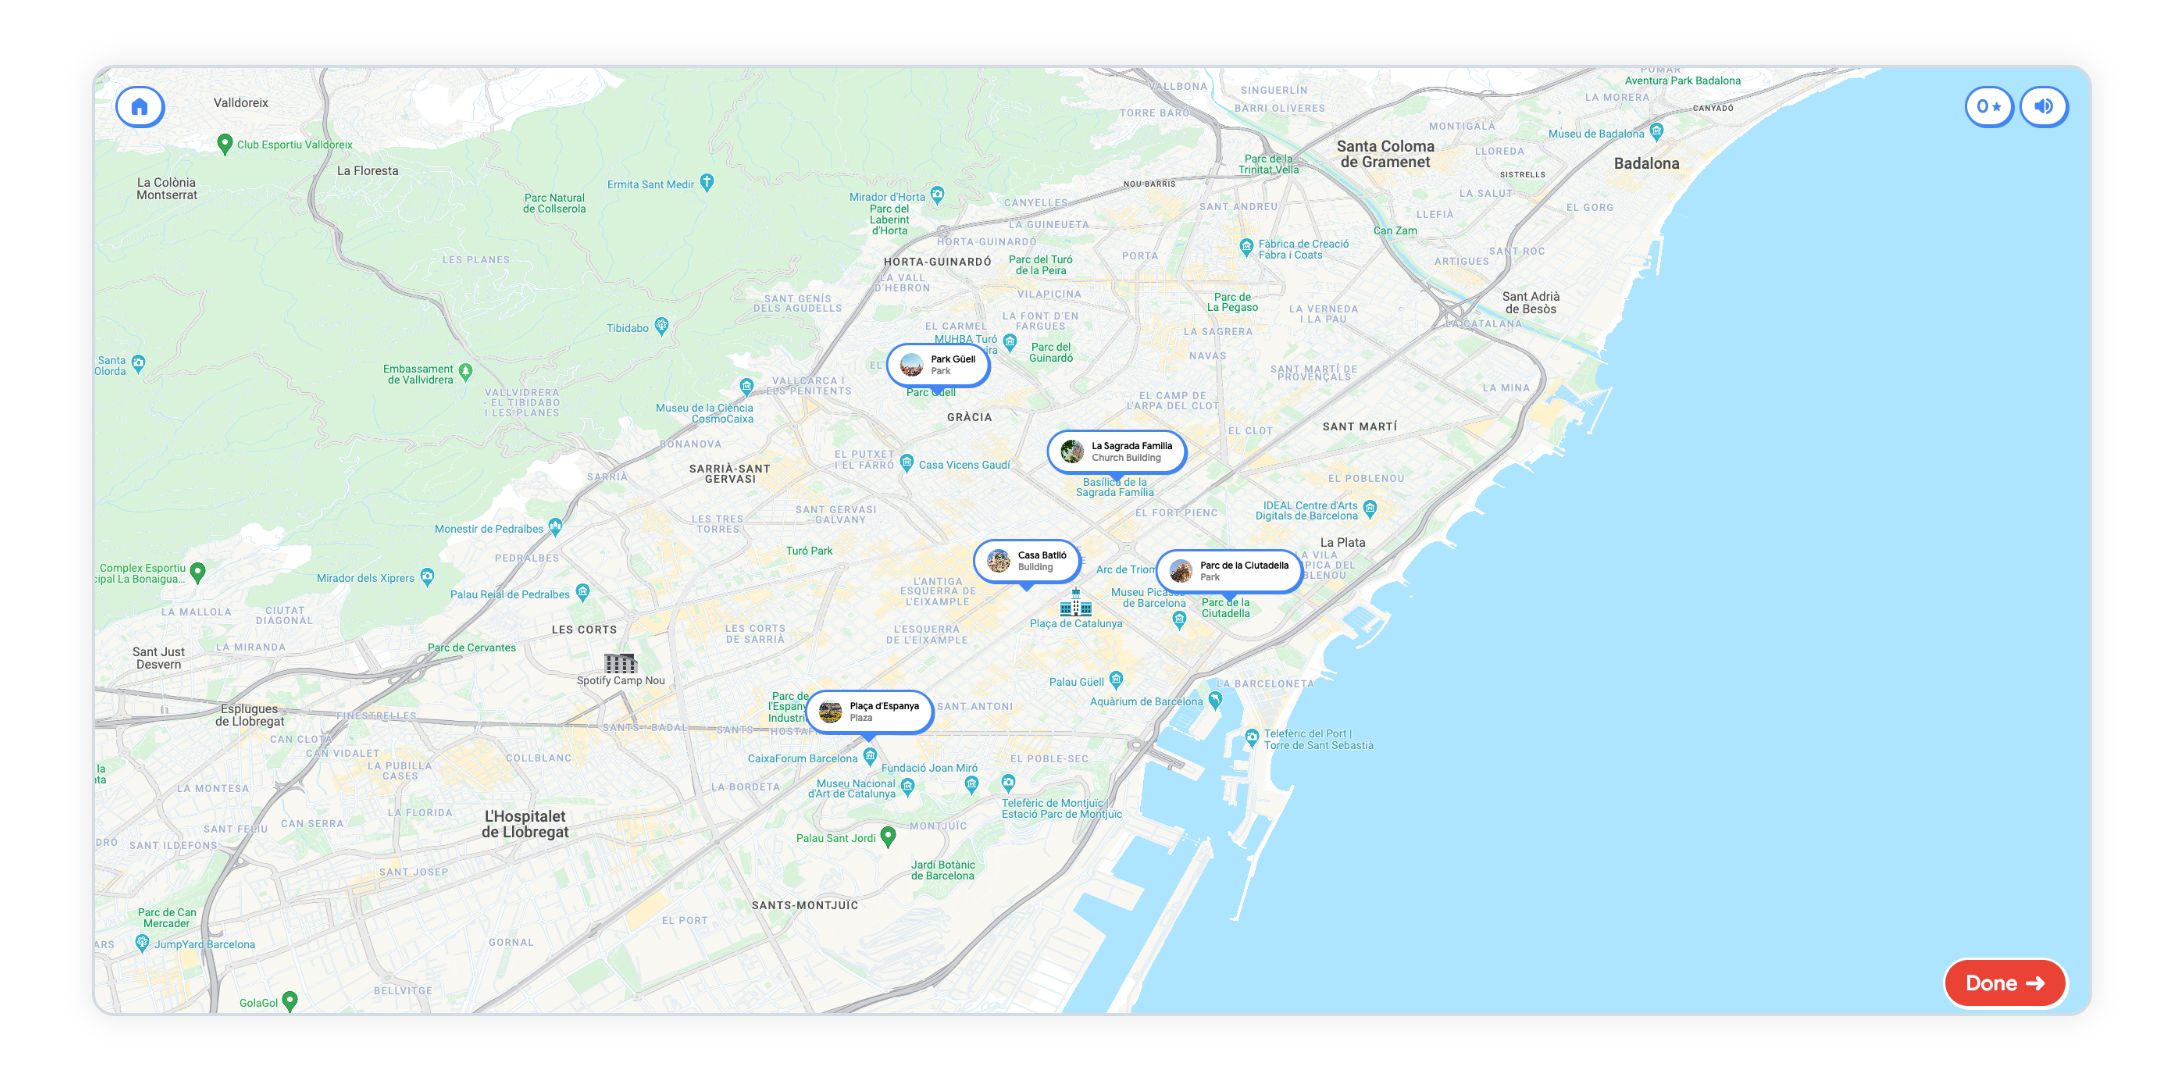
Google Maps is a familiar name. But the Google Maps Platform takes mapping to the next level.
With this tool, you can customize maps for your website or app. Add markers, change map styles, or overlay data like traffic or population density.
Features:
- Dynamic maps: Maps that update in real time.
- API access: Ideal for developers.
- Wide data coverage: Google’s database is unmatched.
This tool is best for businesses looking to integrate maps into their services or apps.
3. QGIS
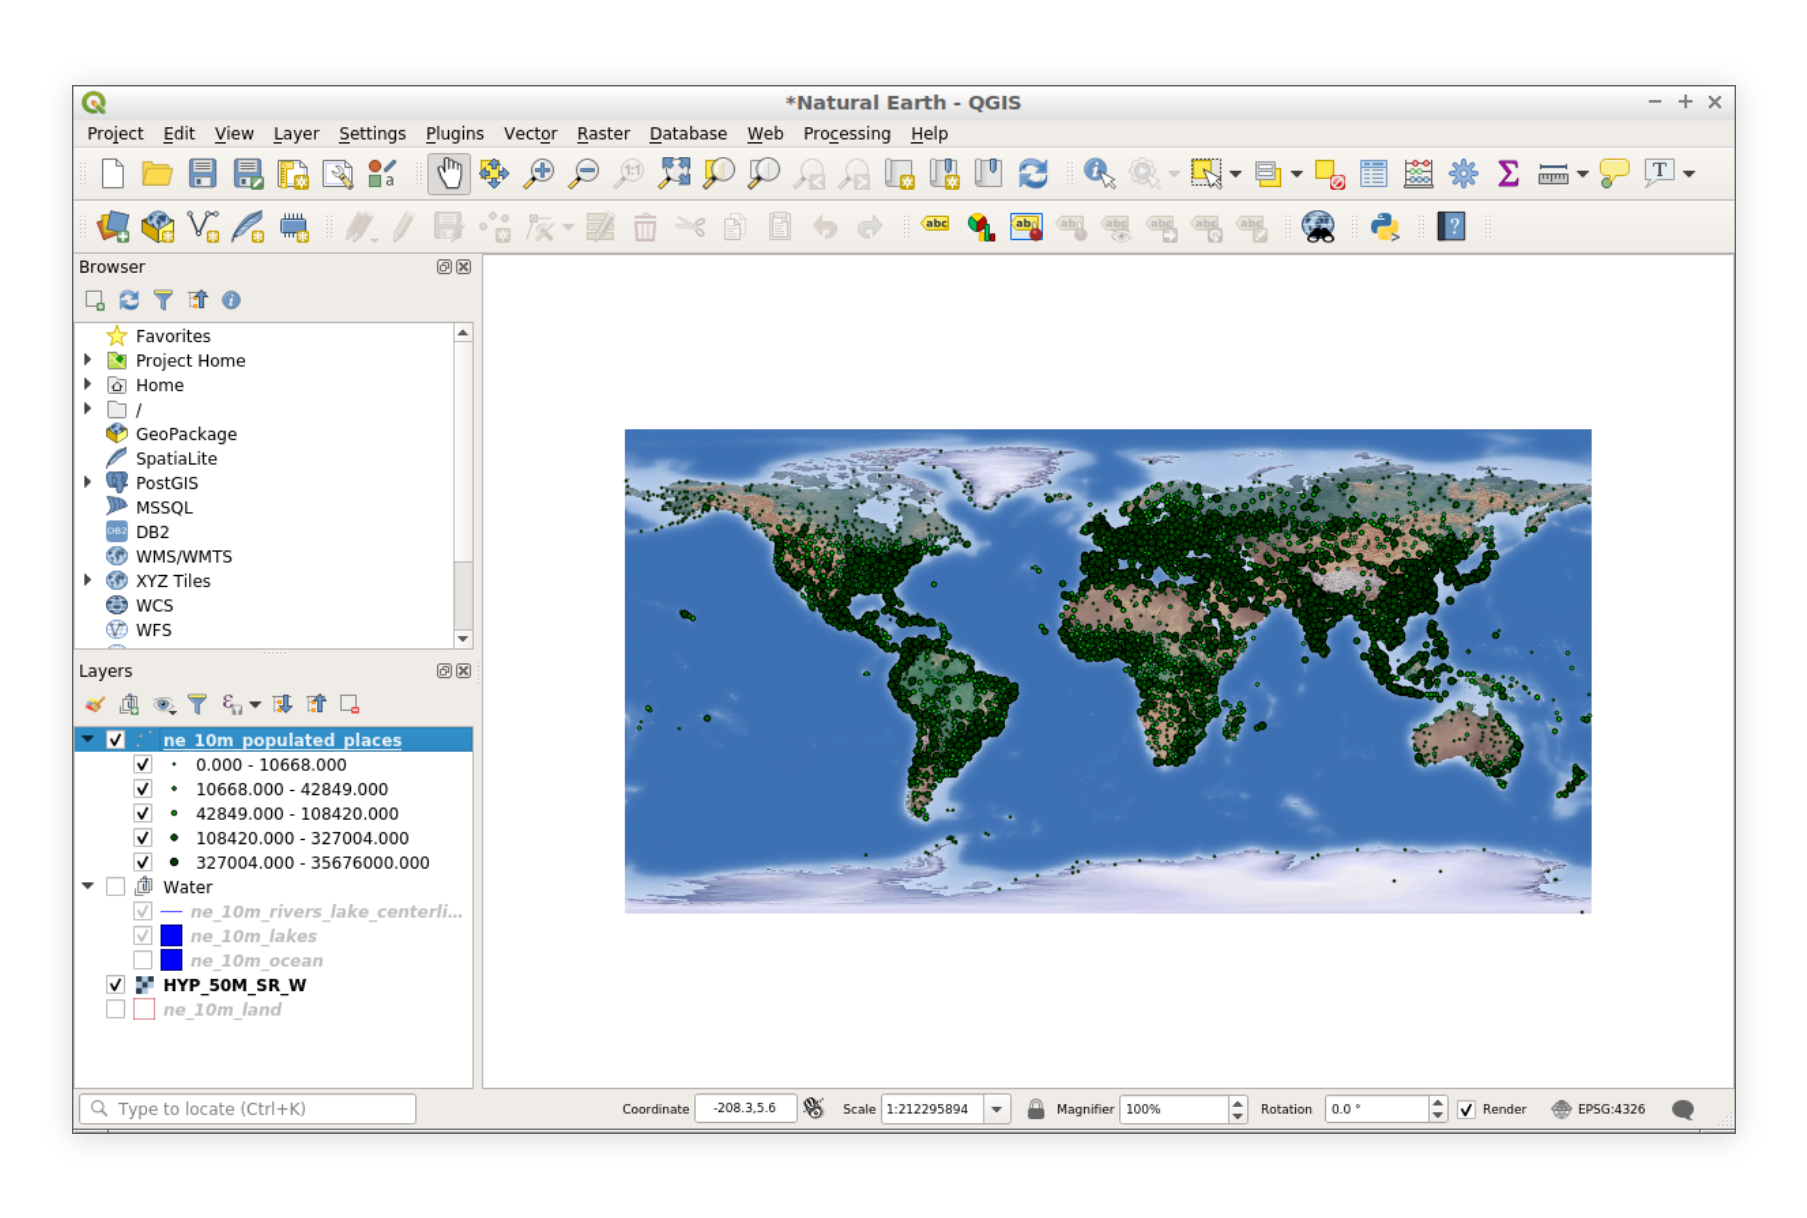
QGIS is a free and open-source tool that’s loved by GIS professionals.
It’s feature-rich and supports advanced mapping and spatial analysis. However, it’s more complex than some other tools on this list.
If you’re willing to invest time in learning, QGIS offers almost limitless possibilities.
Highlights:
- Powerful analysis tools: Perfect for data-heavy projects.
- Wide format support: Import almost any data type.
- Community-driven: Regular updates and free plugins.
QGIS is best for those with a bit of GIS experience or who need advanced capabilities.
4. Mapbox
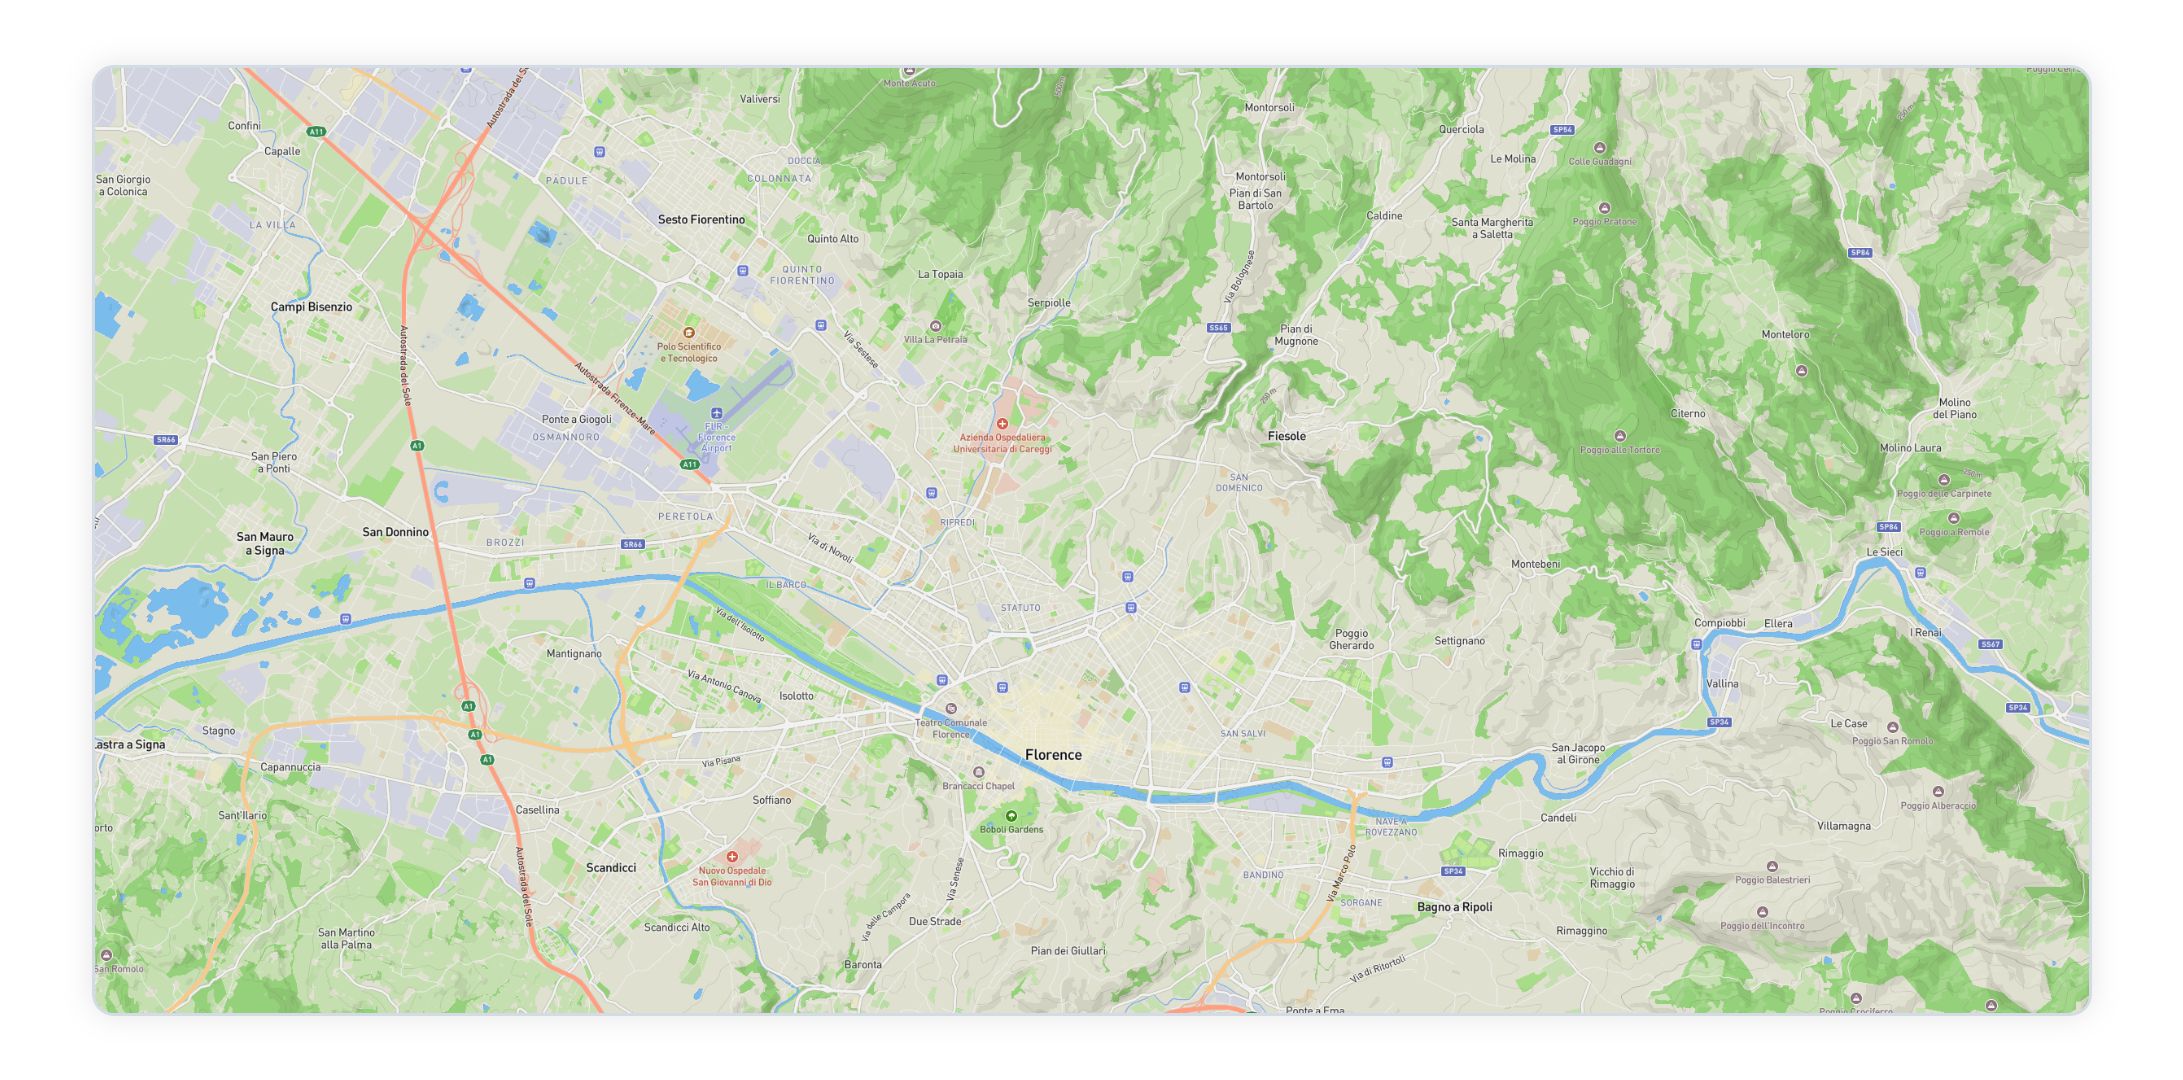
Mapbox is a robust tool for creating interactive maps. It’s popular with developers and designers who want custom map visuals.
Mapbox allows you to build maps that feel unique to your brand. It also has APIs for adding maps to apps or websites.
Why Use Mapbox?
- Interactive features: Zoom, pan, and explore maps easily.
- Custom design: Tailor colors, fonts, and icons.
- Scalable: Great for high-traffic websites or apps.
Mapbox is ideal for developers and designers who want creative control.
5. ArcGIS Online
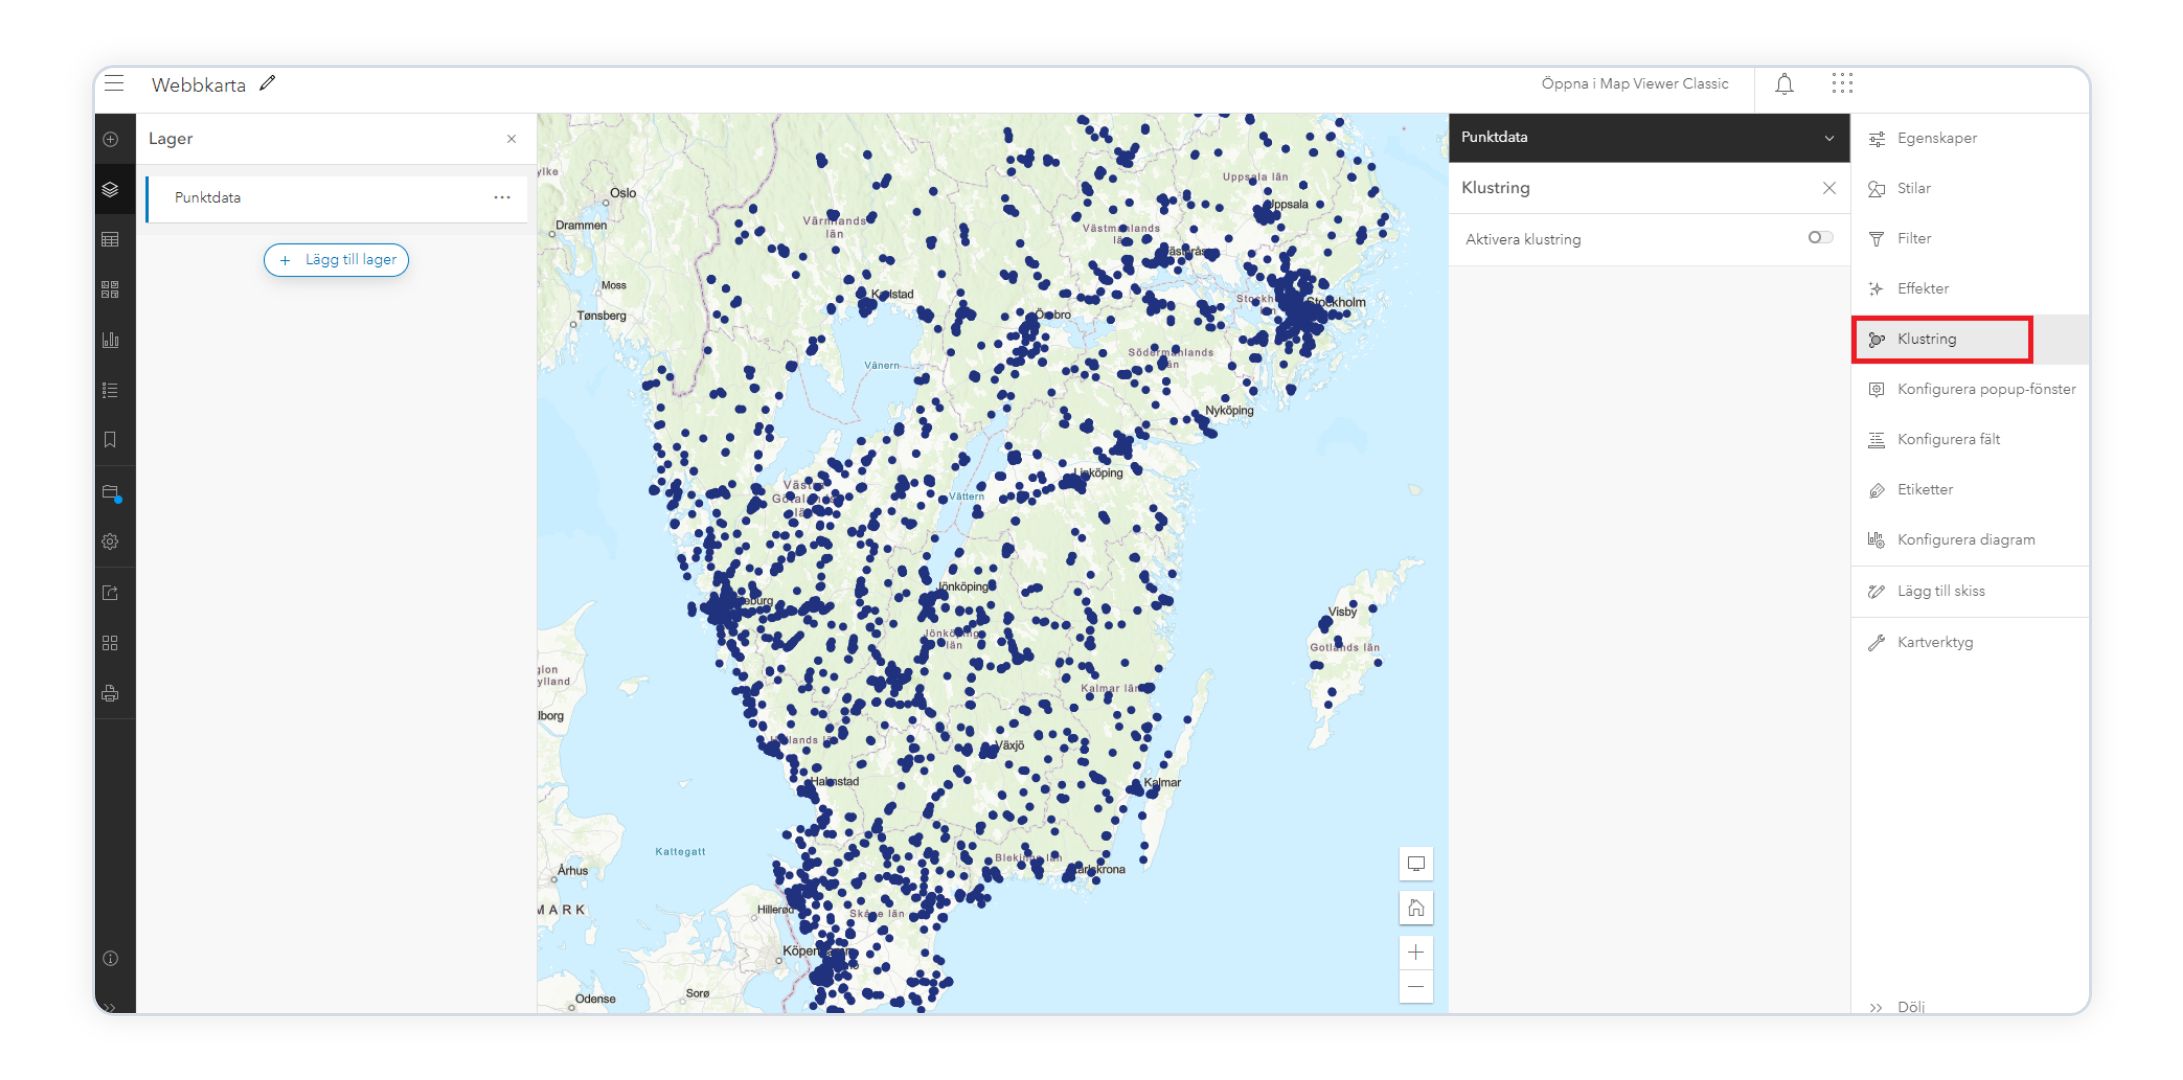
ArcGIS Online is a cloud-based mapping tool from Esri. It combines powerful GIS capabilities with a user-friendly interface.
With ArcGIS Online, you can analyze data, share maps, and create stunning visualizations. It also integrates well with other Esri products.
Key Features:
- Advanced analysis: For detailed spatial insights.
- Collaboration tools: Share maps and projects easily.
- Rich content library: Access ready-made datasets.
This tool is perfect for organizations needing professional-grade maps and collaboration features.
6. Canva Maps
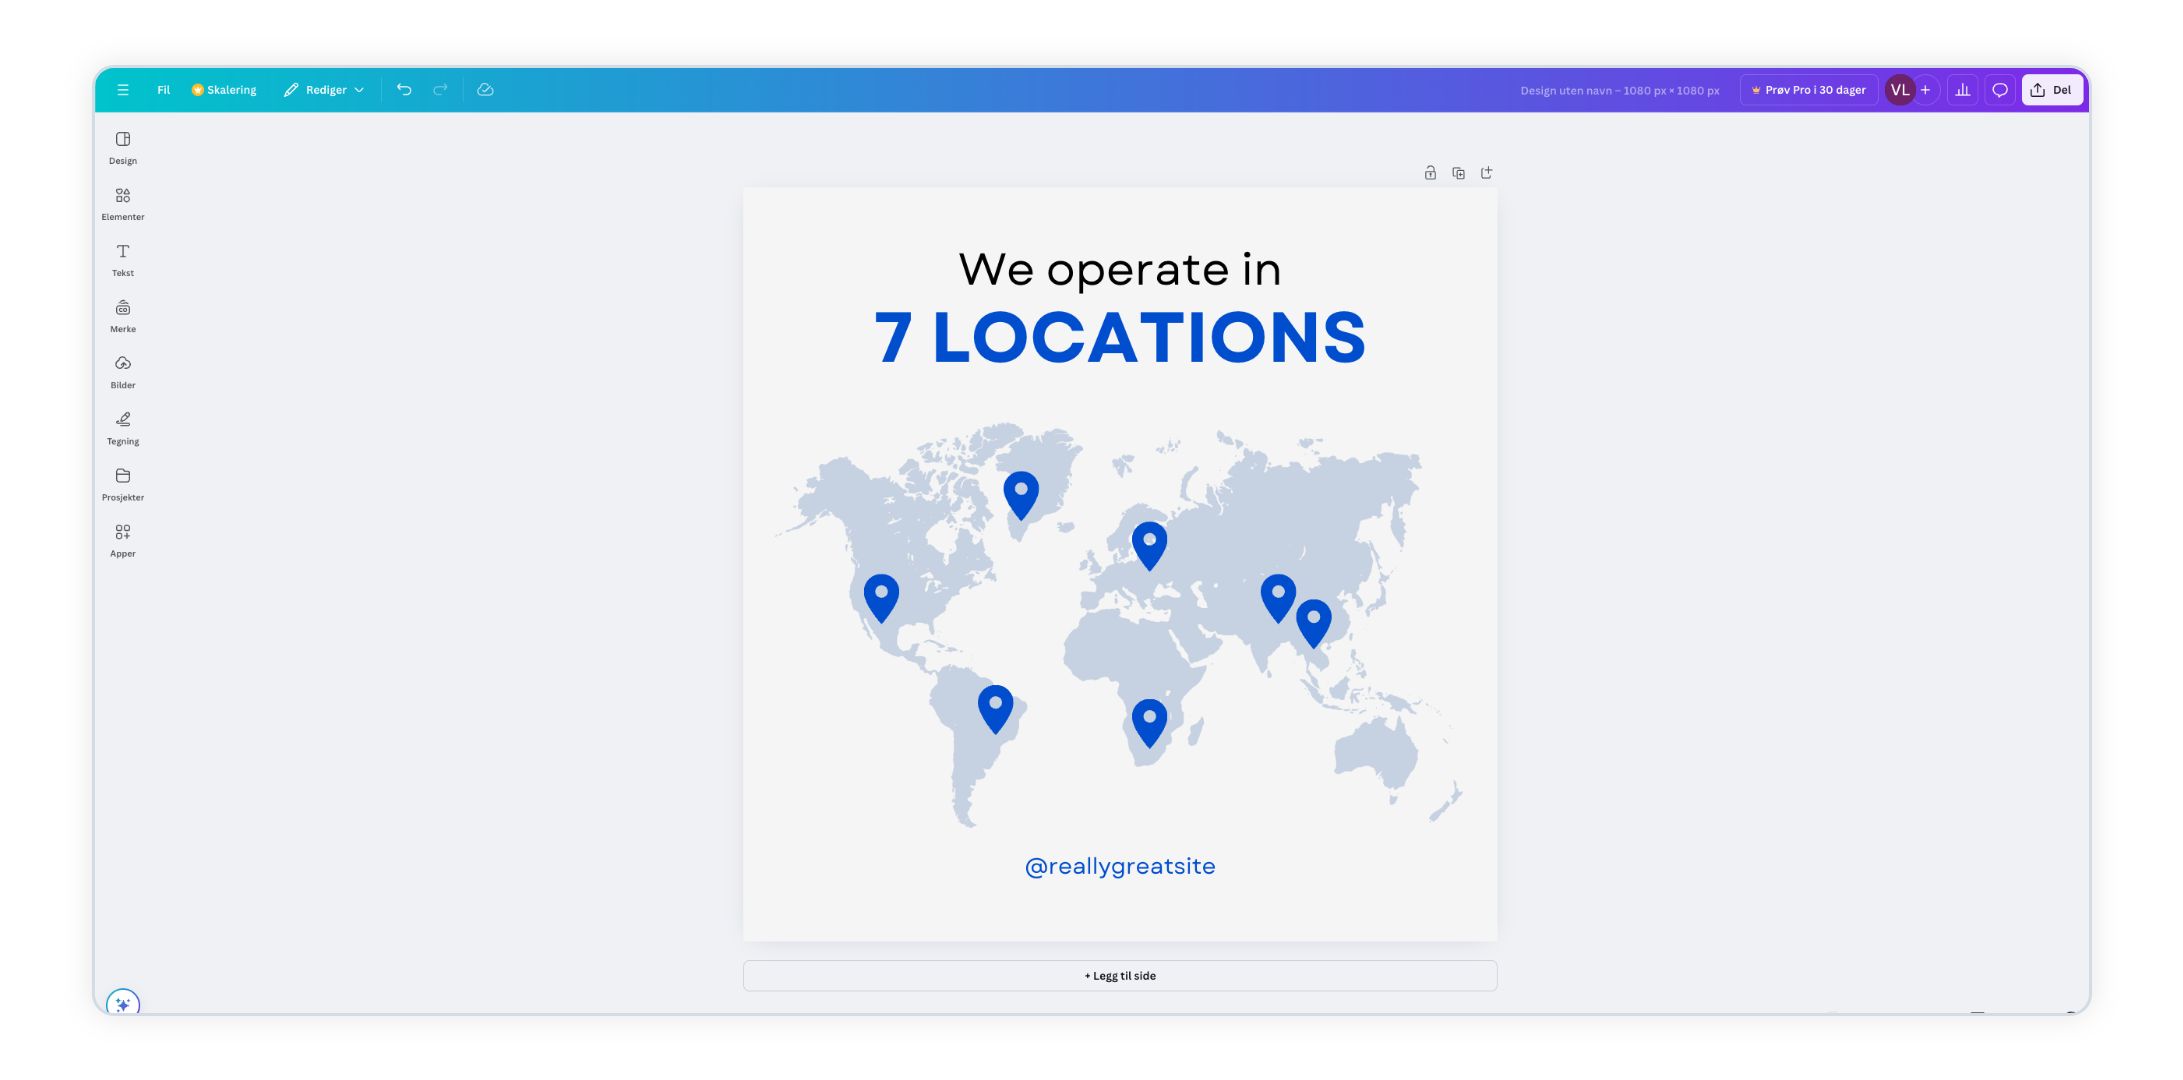
Canva is well-known for graphic design. But did you know it also lets you create simple maps?
With Canva, you can add maps to presentations, social media posts, or reports. The drag-and-drop interface makes it quick and easy.
What Makes Canva Unique?
- No GIS knowledge required: Purely visual.
- Pre-designed templates: Save time.
- Wide audience: Perfect for non-technical users.
Canva is great for casual map creation or when presentation is key.
7. Flourish
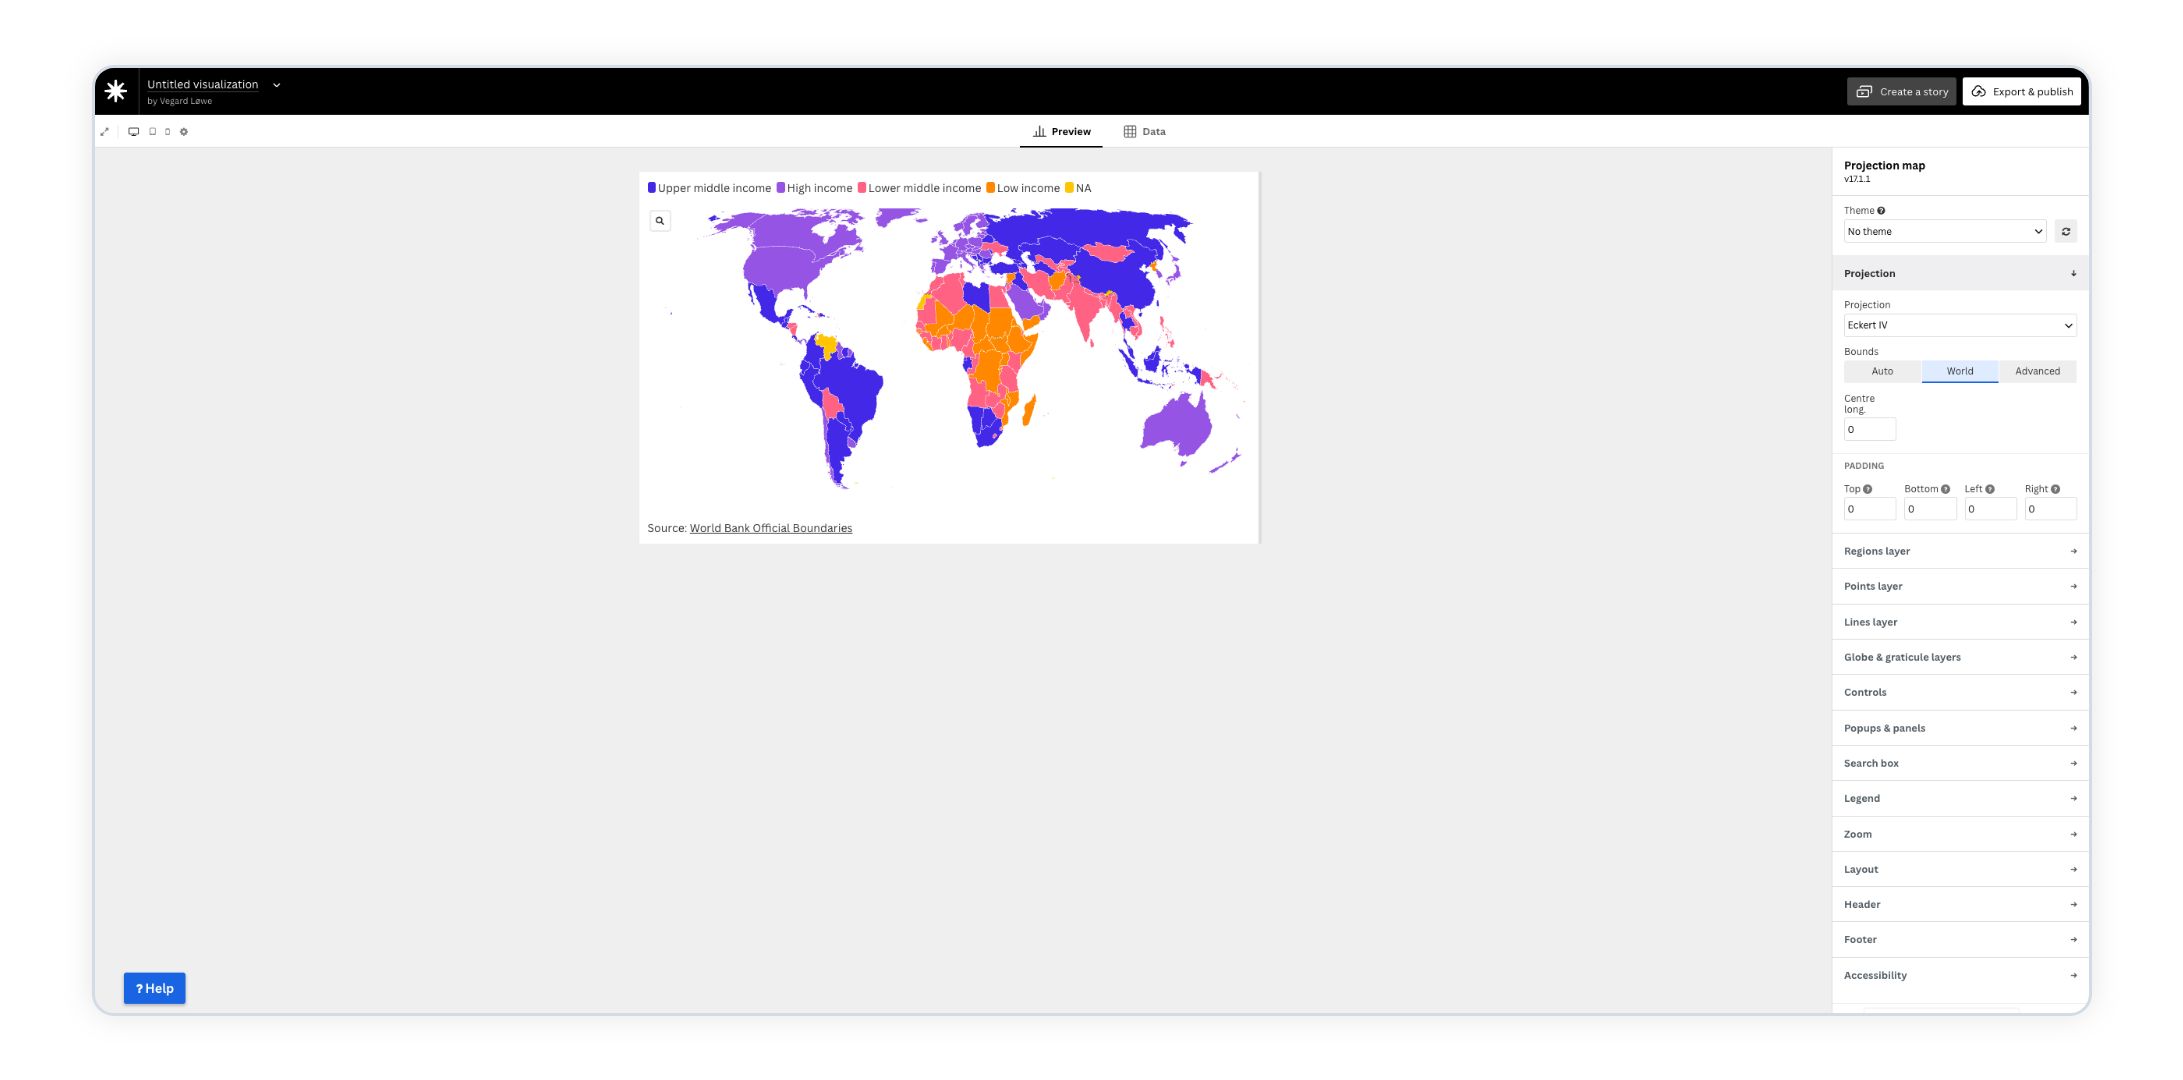
Flourish is a data visualization tool that includes map-making features.
It’s built for storytelling. You can create animated maps, heatmaps, and more, all with just a few clicks.
Why Flourish Stands Out
- Animation support: Bring your maps to life.
- Interactive designs: Engage your audience.
- Simple interface: No steep learning curve.
Flourish is perfect for journalists, marketers, or anyone creating visual stories with maps.
8. Tableau
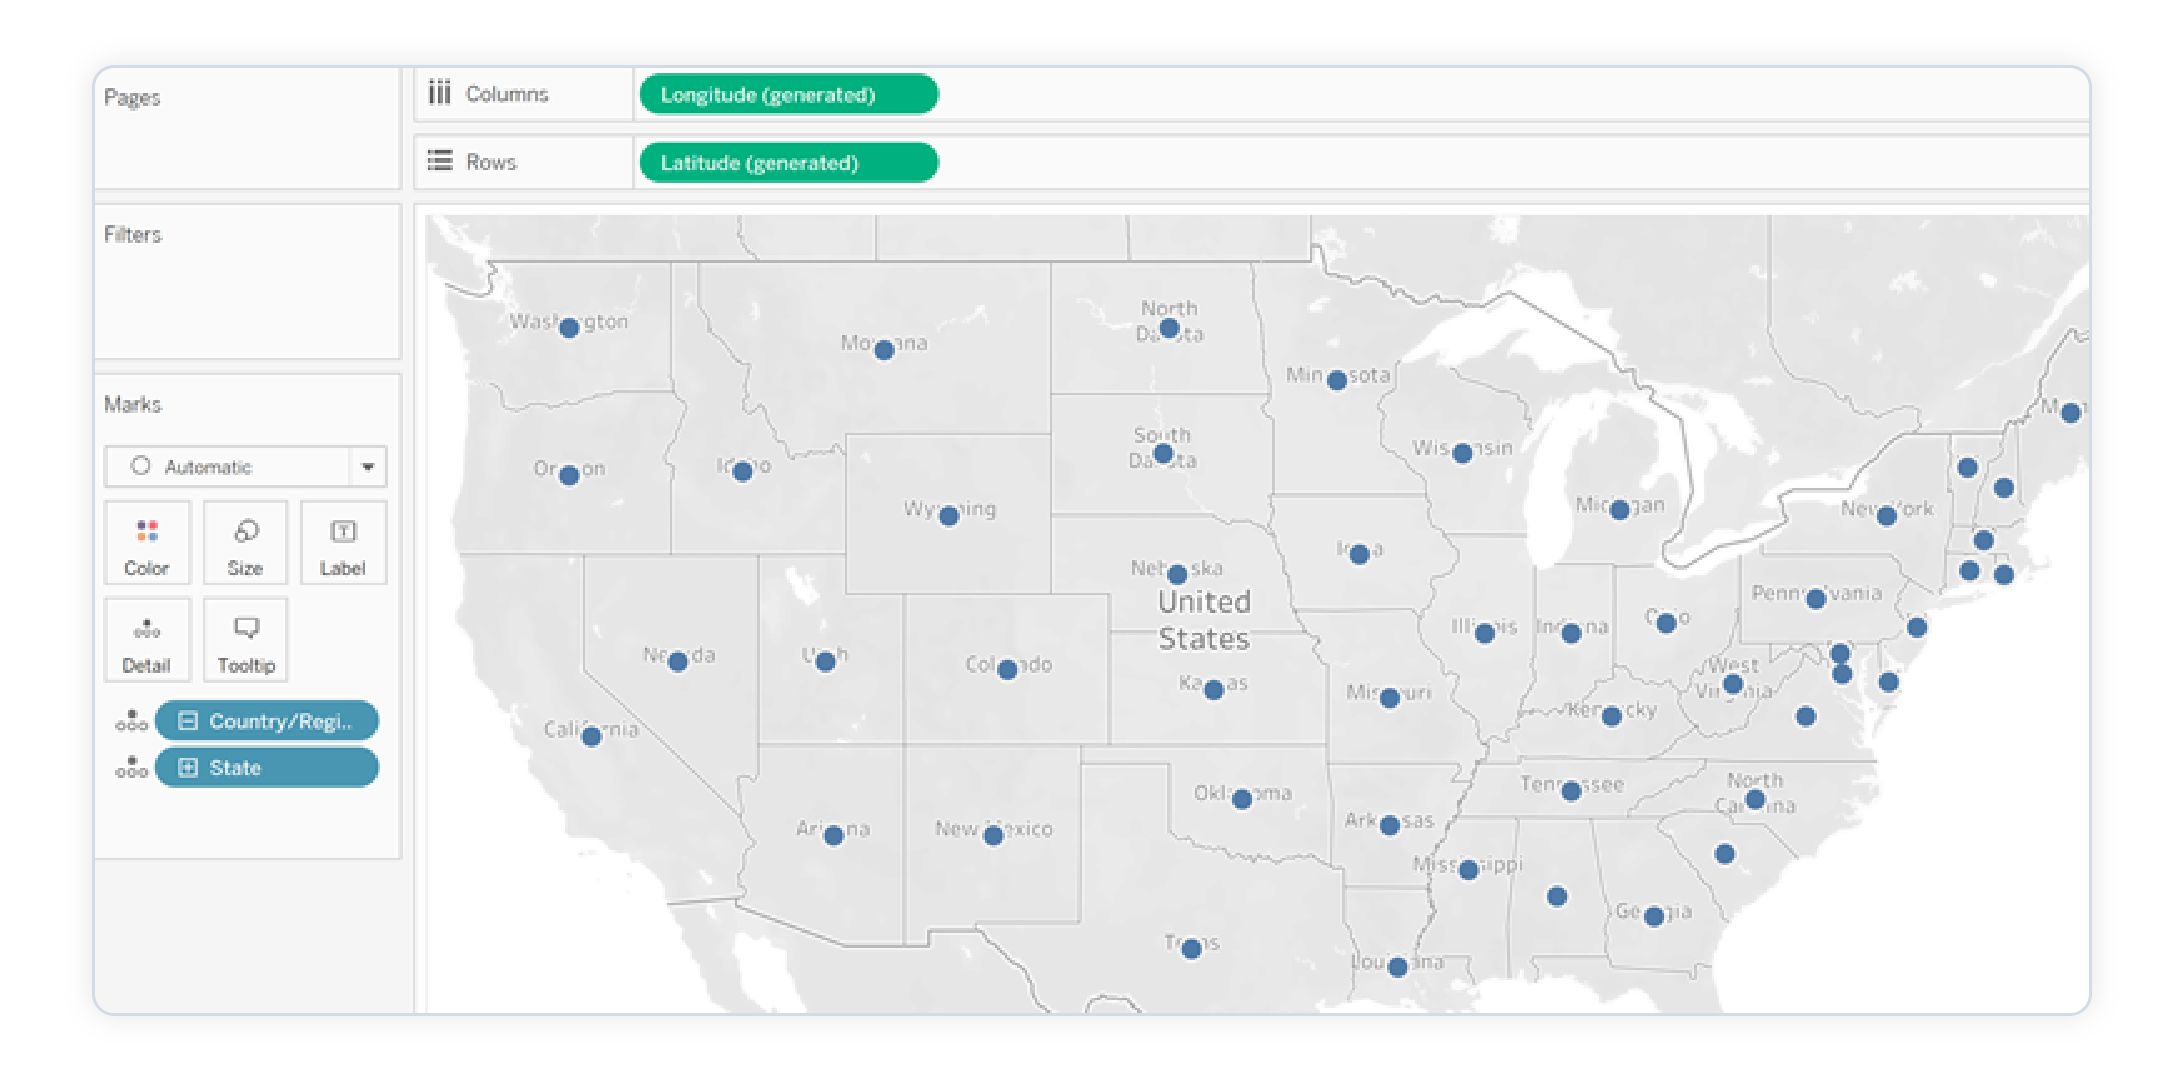
Tableau is a powerful data visualization tool. Its mapping features are just one part of its capabilities.
With Tableau, you can create interactive maps that update as your data changes. It’s especially popular in business analytics.
Features to Note:
- Real-time updates: Great for live dashboards.
- Seamless data integration: Connect to databases and spreadsheets.
- Professional look: Polished visuals.
Tableau is ideal for businesses and analysts who want data-driven maps.
9. CARTO
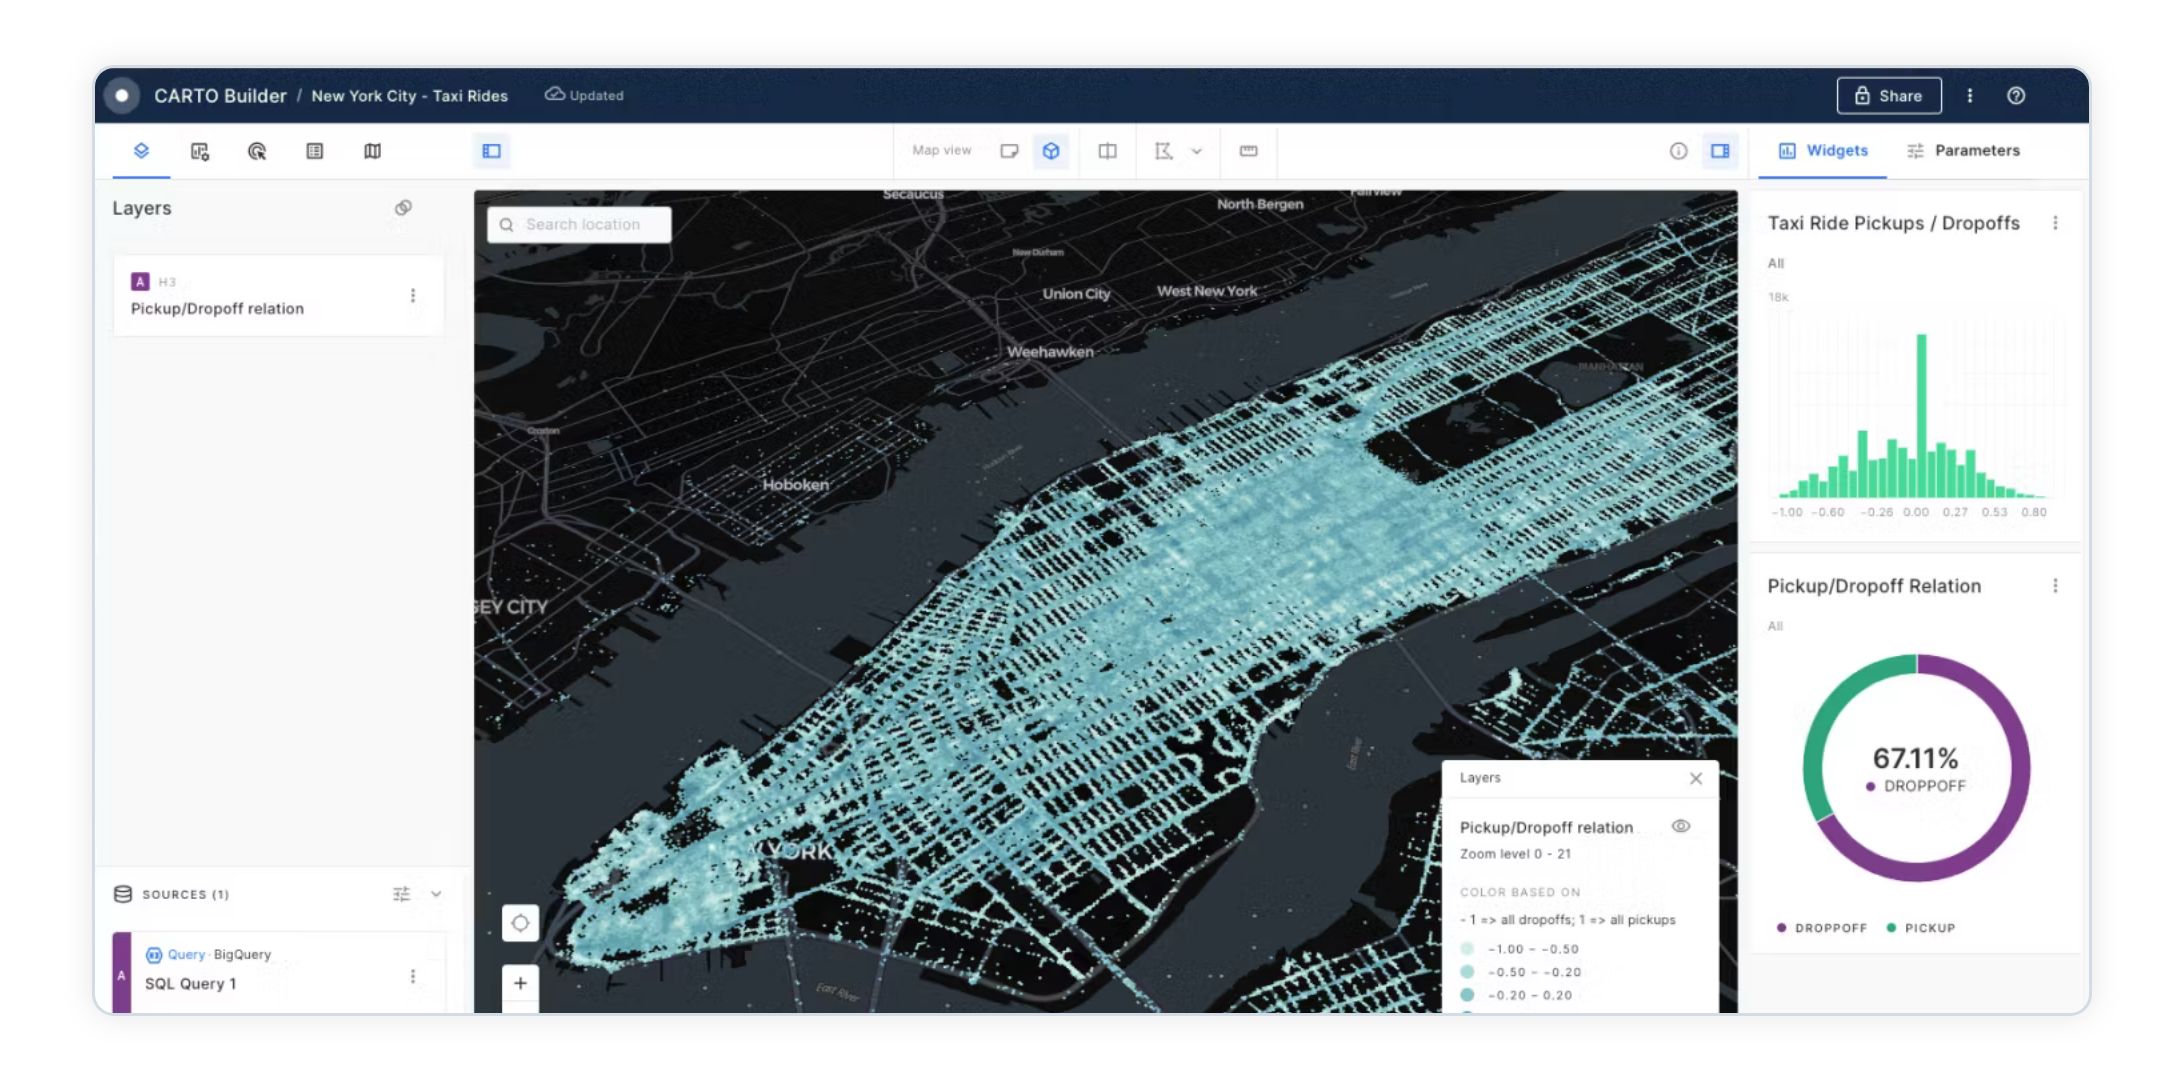
CARTO is a location intelligence platform. It helps businesses and researchers analyze spatial data for better decision-making.
CARTO’s tools are powerful but accessible. You can create maps, run spatial analyses, and even integrate machine learning models.
Why Choose CARTO?
- Advanced analytics: Go beyond basic maps.
- Business-focused: Great for market analysis.
- Customizable: Build what you need.
CARTO is best for organizations looking to gain insights from location data.
10. MapTiler
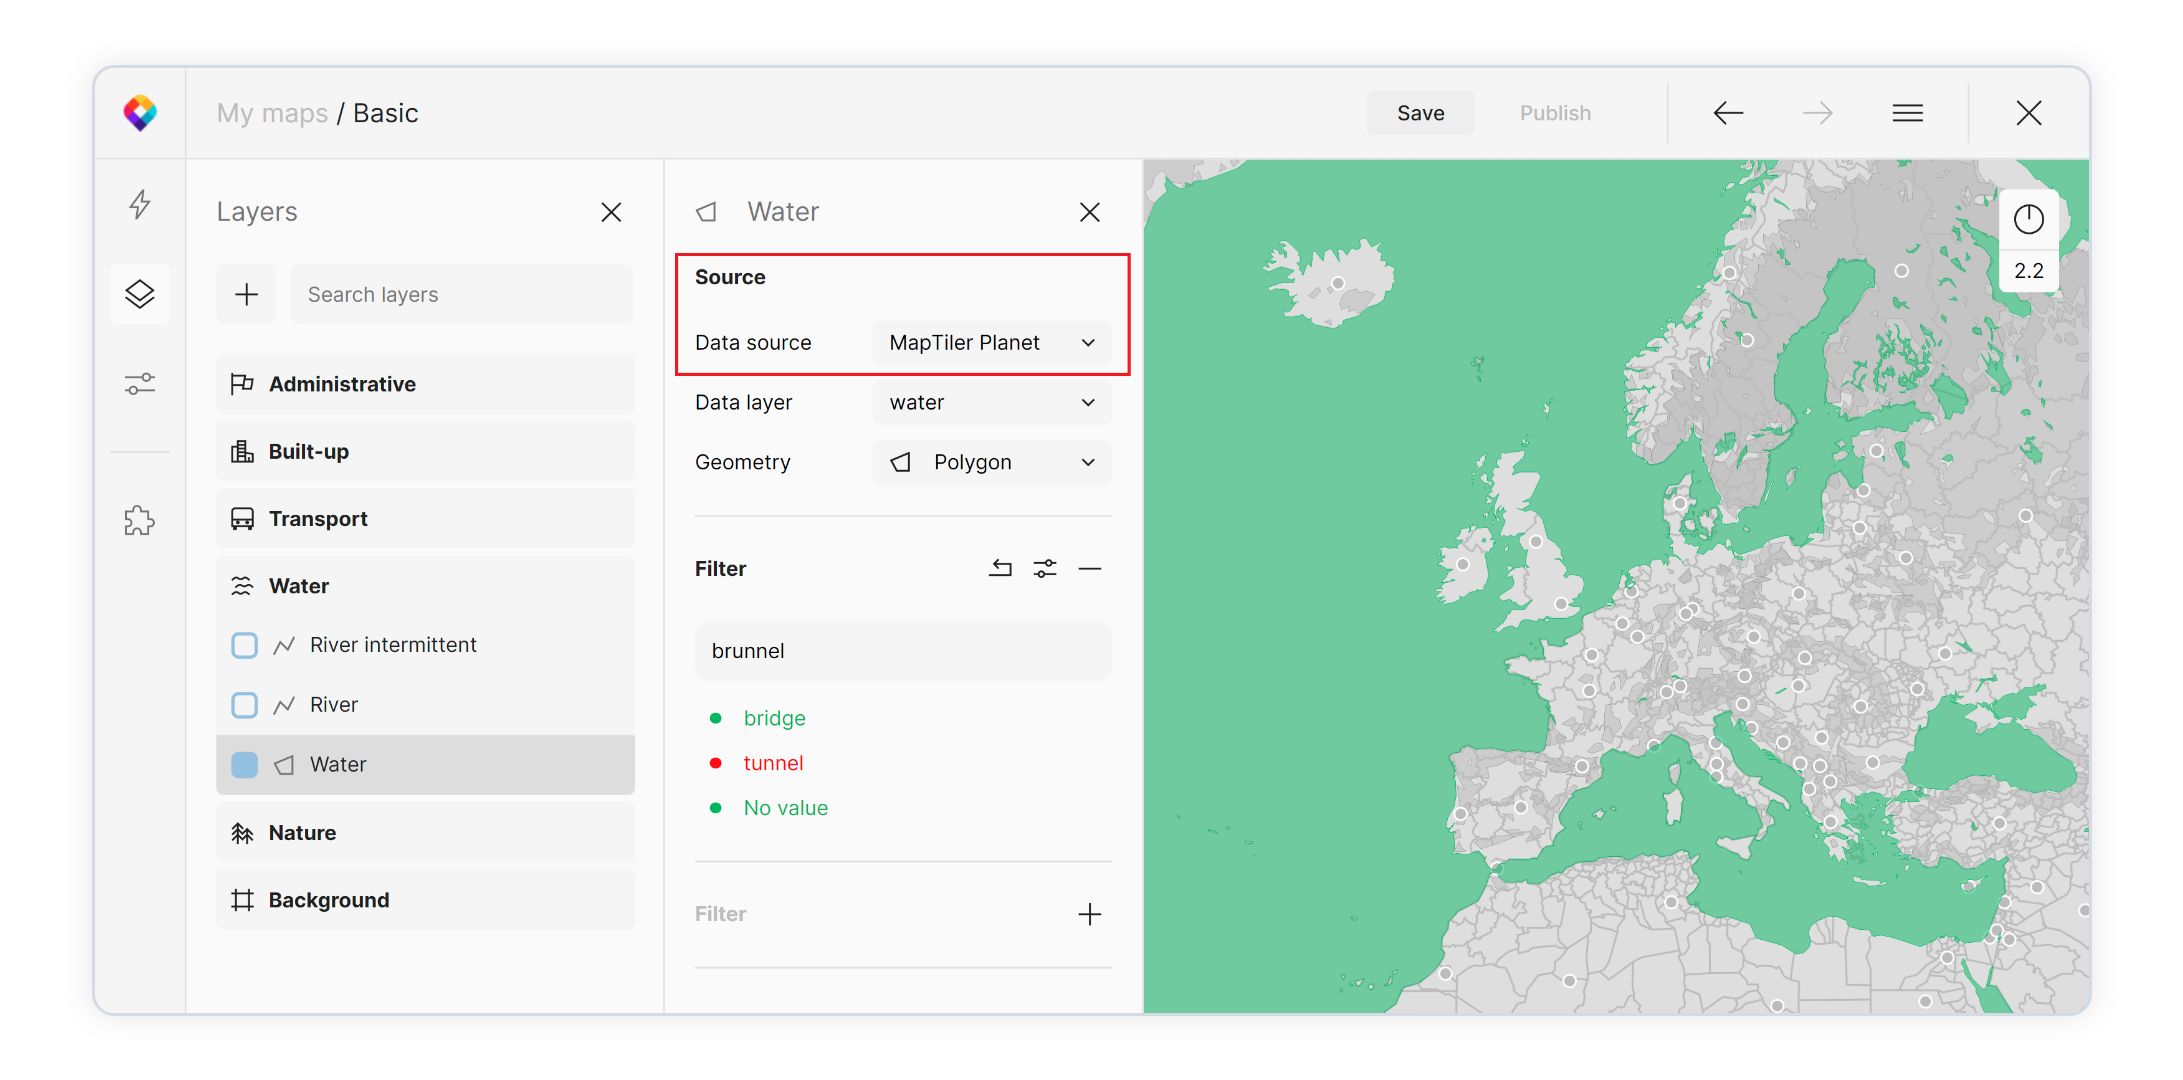
MapTiler is a versatile tool for creating custom maps. It’s popular with developers and designers who need full control over map design.
You can upload your data, tweak styles, and export maps for use on websites, apps, or print materials.
Key Advantages:
- Custom map tiles: Unique visuals.
- Offline options: Use maps without internet.
- Developer-friendly: APIs and SDKs available.
MapTiler is perfect for those needing flexible, professional-grade maps.
Final Thoughts
With so many tools available, creating maps is no longer just for experts.
Whether you want a simple map for a report or an interactive visualization for a website, there’s a tool to match your needs. Explore these platforms, and bring your data to life.

