Using Satellite Data to Measure Economic Activity
Economic growth has traditionally been measured using metrics like GDP, employment rates, or industrial output. These indicators, while insightful, rely heavily on accurate and timely data collection, which can be challenging in some regions.
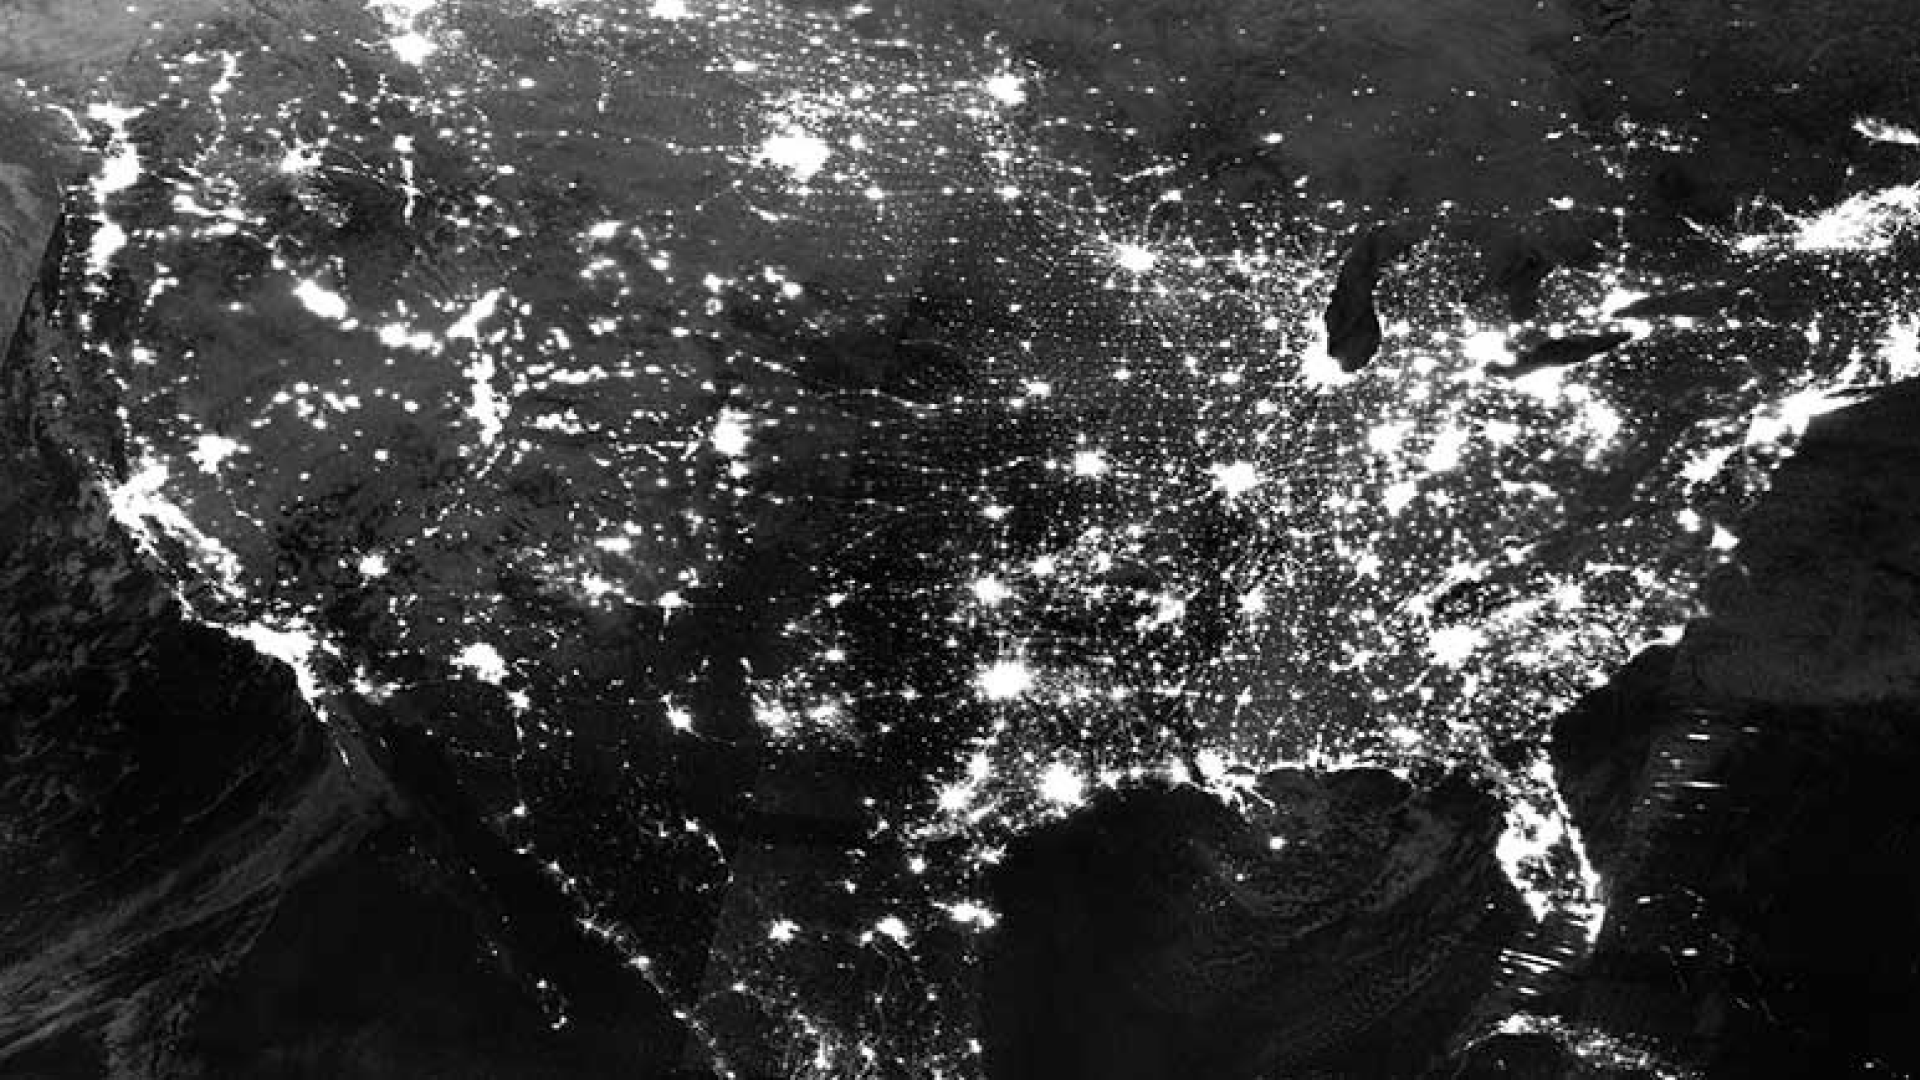
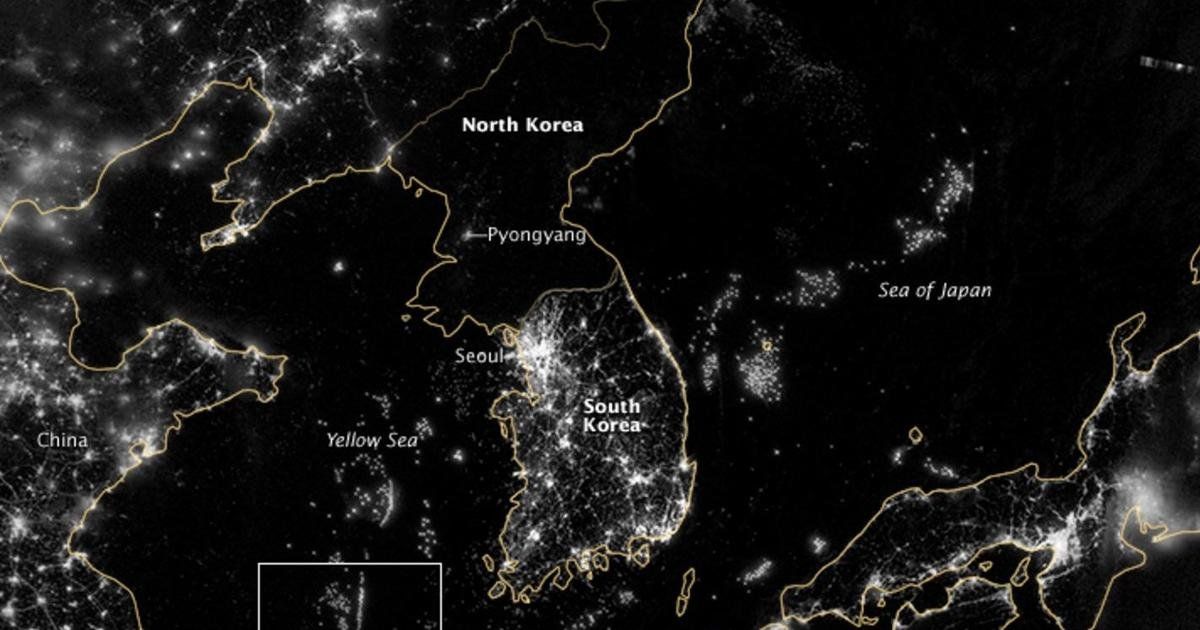
A novel approach uses satellite imagery to measure the brightness of nightlights as a proxy for economic activity. Brighter areas, as captured by satellites, often correlate with higher levels of industrial activity, energy consumption, and population density—key indicators of economic vitality.
Why Nightlights Matter
Nightlight data provides a unique perspective:
- Global Reach: Satellite data covers areas where traditional economic measurements are unavailable or unreliable, particularly in developing countries or regions with minimal infrastructure.
- Frequent Updates: Nightlights are observed consistently, offering near real-time insights into changes in economic activity.
- Visualization: Brightness levels provide a visual cue to the extent of urbanization and industrial growth, helping analysts spot trends at a glance.
Insights Gained from Nightlight Analysis
Nightlight data has been used to uncover patterns of growth and inequality. Here’s how it has been applied:
- Urbanization: Rapidly urbanizing regions appear brighter over time, reflecting infrastructure development and increased economic activity.
- Disaster Recovery: Changes in nightlight intensity post-disaster (like after hurricanes or earthquakes) can reveal the speed and effectiveness of recovery efforts.
- Policy Impact: Governments can monitor how policy decisions—like investment in infrastructure—affect economic activity, using brightness changes as indicators.
- Conflict Zones: In war-torn areas, declining brightness often signals economic decline or population displacement.
Challenges in Using Nightlights
Despite its advantages, using nightlight data has challenges:
- Data Quality: Cloud cover, seasonal variations, and satellite capabilities can impact data accuracy.
- Economic Nuance: Brightness doesn’t capture all economic activities, such as agriculture or informal economies.
- Interpretation Complexity: Correlation does not imply causation. A brighter area might not always mean economic prosperity; it could indicate inefficiencies like energy wastage.
GIS and Nightlight Data Analysis
Platforms like Atlas are particularly suited for handling nightlight data. GIS tools enable:
- Overlaying Layers: Combine nightlight data with population density, infrastructure maps, or economic statistics for deeper insights.
- Temporal Analysis: Monitor how areas evolve over time by comparing historical satellite images.
- Interactive Visualization: Allow policymakers and stakeholders to interact with data, exploring correlations and potential causal factors.
With Atlas’s browser-based GIS capabilities, analysts can upload satellite imagery and overlay it with other economic datasets to derive actionable insights without needing advanced technical skills.
Real-World Applications
- Tracking Urban Growth: Nightlight data highlights burgeoning urban areas, helping city planners prioritize resource allocation.
- Monitoring Infrastructure Projects: Governments can assess the impact of new roads, electricity grids, or industrial parks by observing brightness changes in those regions.
- Development Aid Allocation: International organizations can identify underdeveloped regions in need of aid by analyzing low-brightness areas.
- Climate Impact Studies: Researchers can study how environmental changes, like rising sea levels or deforestation, affect human settlements.
Accessibility with Modern GIS Platforms
For teams looking to incorporate nightlight data into their analyses, browser-based GIS platforms like Atlas offer an accessible solution. Unlike traditional GIS tools that require high technical expertise and local installations, Atlas simplifies geospatial analysis:
- Real-Time Collaboration: Teams can analyze nightlight data together from different locations, making it easier to interpret complex datasets.
- Ease of Sharing: Interactive maps created on Atlas can be shared with stakeholders for real-time decision-making.
- Flexible Tools: Atlas’s capabilities