Creating a city map that balances accuracy with design can be challenging, but using the right tools makes all the difference.
In this guide, we’ve chosen to use Atlas and Adobe Illustrator - a combination that offers both precision and creative control.
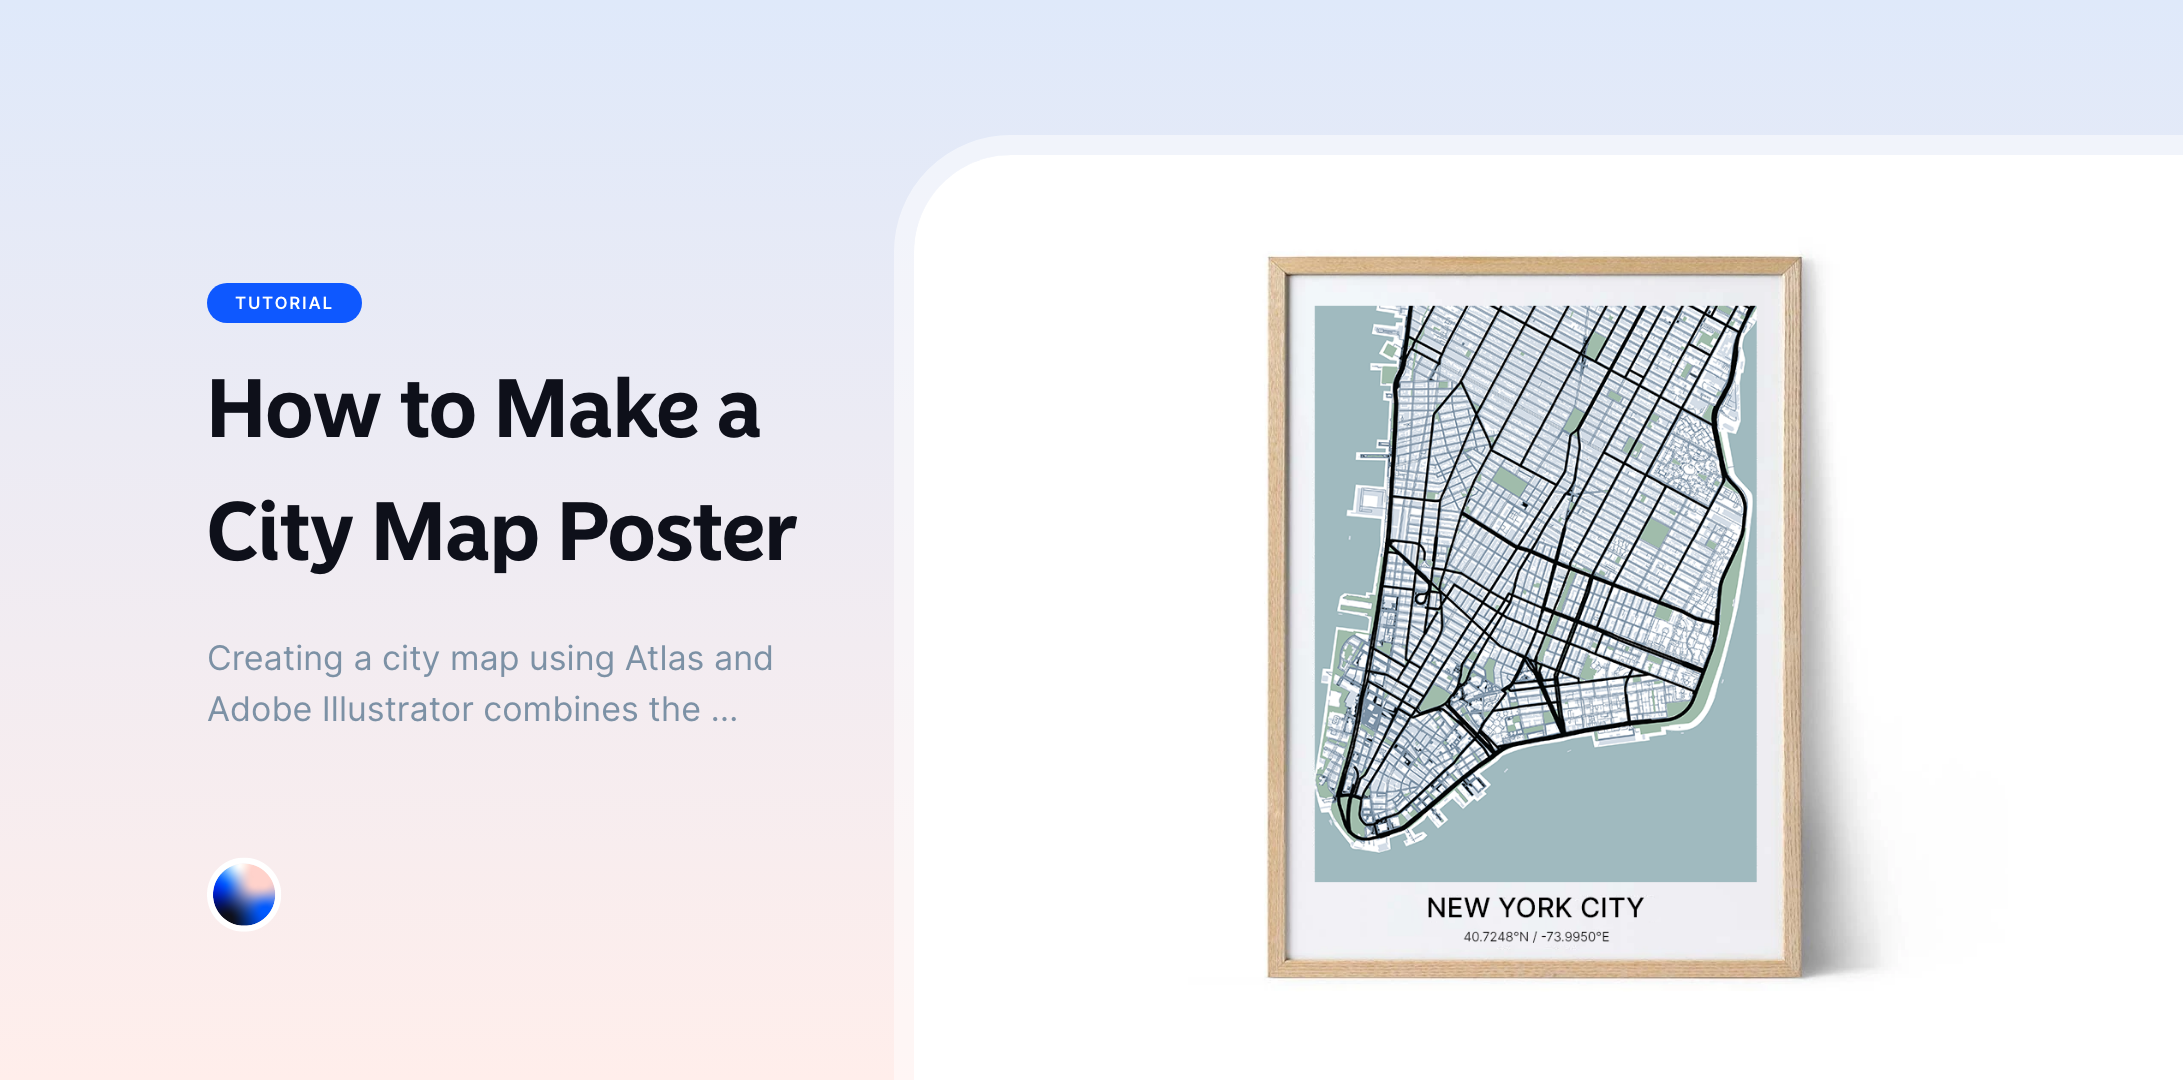
Creating a city map using Atlas and Adobe Illustrator combines the strengths of both tools. Atlas is great for quickly generating and exporting geographic data, while Illustrator gives you full control over the design and style.
1. Define Your Map’s Purpose
Before you start, it's essential to clarify the purpose of your map. Knowing what you want to achieve will guide your decisions throughout the process.
Ask yourself:
- What information do I want to convey?
- Who will use this map?
- What features of the city are most important?
Defining the purpose will help you determine which data to include and how detailed your map needs to be.
2. Gather Your Data Using Atlas
Atlas is a powerful, browser-based GIS platform that allows you to easily access and manipulate geographic data. Here’s how to gather the necessary data for your map:
a. Open Atlas and Create a New Project
- Go to the Atlas and log in or create an account if you don’t have one.
- Create a new project. You can search for the city by name or manually zoom into the desired location.
b. Import Data
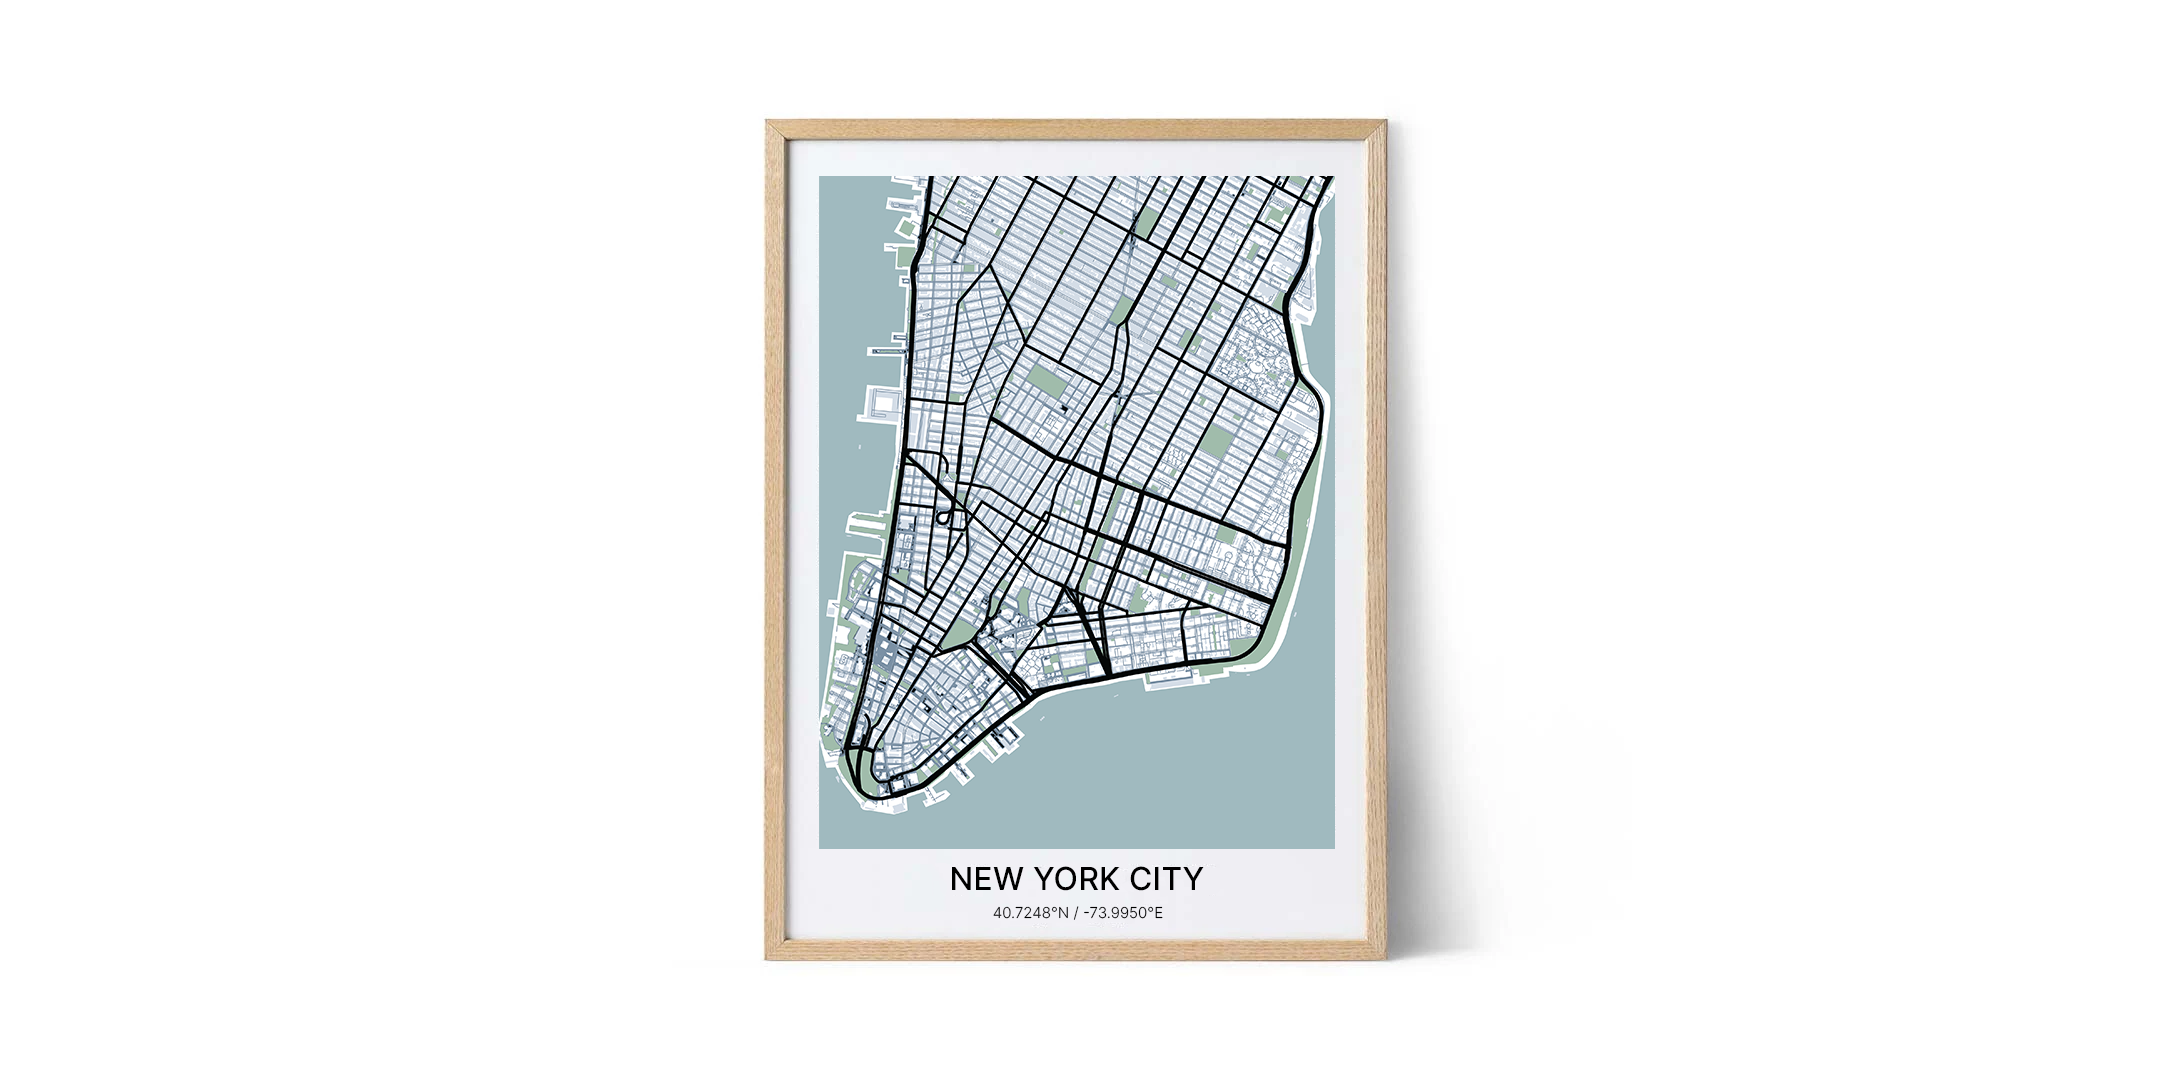
- Query OpenStreetMap Data: Use Atlas to query data from OpenStreetMap. This allows you to access detailed information like roads, buildings, parks, and more. Simply select the layers you need for your map. In this case, I only want Manhattan of New York, so I draw a polygon and query data within this area.
- Remove Unnecessary Details: Remove any features that are not relevant to your map’s purpose. For example, if you are focusing on major roads, you can remove smaller streets.
c. Download Data
- Download Data: Once you have selected the relevant data layers, download them in DXF format. DXF files are compatible with Adobe Illustrator, allowing for easy import and editing in the design phase.
3. Import the Data into Adobe Illustrator
Now that you have downloaded the data from Atlas, it’s time to import it into Adobe Illustrator for further customization.
a. Open Illustrator and Create a New Document
- Open Adobe Illustrator and create a new document. Set the dimensions based on how you plan to use the map (print, web, etc.).
- Set the color mode to RGB for digital maps or CMYK for print.
b. Import the Map File
- Go to
File>Placeand select the DXF file you exported from Atlas. - Place the file on your artboard. The map elements should now be editable.
c. Organize Layers
When you open an DXF in Illustrator, it may come with many layers or groups. To make your work easier, start by organizing these layers.
- Ungroup elements as needed: Select objects and go to Object > Ungroup.
- Rename layers for clarity: Double-click the layer names to rename them.
- Hot tip: Use one layer for each type of data. E.g. buildings and roads in separate layers.
4. Customize the Map in Illustrator
Illustrator gives you complete control over the design aspects of your map. Here’s how to customize it:
a. Refine the Map’s Appearance
- Edit Colors: Use Illustrator’s color tools to adjust the colors of roads, buildings, and other features. You can create a custom color scheme that fits your project’s theme.
- Adjust Line Weights: Make roads or boundaries stand out by adjusting the stroke weight. Thicker lines can be used for major roads, while thinner lines can represent minor streets.
- Simplify Elements: If needed, further simplify the map by removing unnecessary details or combining similar elements. This helps maintain a clean and focused design.
b. Add Labels and Text (optional)
- Label Important Features: Use the Type tool to add labels to key locations such as neighborhoods, streets, landmarks, or parks. Choose a font that is legible and fits the map's aesthetic.
- Title: Add a simple title to your map.
c. Incorporate Design Elements (optional)
- Use Icons and Symbols: Illustrator allows you to add custom icons for specific locations like hospitals, schools, or tourist attractions. Keep these symbols simple to align with the map’s style.
- Add Decorative Elements: Consider adding subtle decorative elements like borders, watermarks, or background textures. Ensure these do not overwhelm the main map content.
5. Review and Refine Your Map
Once you've added all your customizations, take a step back and review your map:
- Check Readability: Ensure that the map is easy to read and that all important features stand out.
- Balance and Composition: Make sure the elements on the map are balanced and that there’s enough white space to avoid clutter.
- Final Touches: Make any final adjustments to colors, labels, or other design elements.
6. Export the Final Map
Once you’re satisfied with your map, the last step is to export it from Illustrator.
a. Choose the Export Format
- For Print: Export the map as a high-resolution PDF, TIFF, or EPS file. Ensure the resolution is set to 300 DPI for print quality.
- For Digital Use: Export as PNG, JPEG, or SVG, depending on where the map will be used. For web use, 72 DPI is usually sufficient.
b. Adjust Export Settings
- Check the Size: Make sure the map is exported at the correct size for its intended use.
- Optimize for Use: If the map is for the web, consider reducing the file size by compressing the image without losing quality.
7. Share or Print Your Map
Now that your map is exported, it’s ready to be shared or printed:
- Sharing Online: You can upload the map to your website, share it on social media, or send it via email.
- Printing: If printing, ensure you use high-quality paper and that the colors are calibrated correctly for the printer you’re using.
Creating a city map using Atlas and Adobe Illustrator combines the efficiency of GIS data with the creative freedom of design software. By following these steps, you can produce a map that is both informative and visually striking.
This approach is perfect for those who want to blend accurate geographic data with a custom, polished design, whether for a project, publication, or personal use.


