

An open letter from Location Data to Spreadsheet.
Dear Spreadsheet,
We need to talk.
I've been putting this off for a while. Years, actually. I kept telling myself things would change. That you'd grow. That one day you'd finally understand what I need.
But I can't do this anymore.
It's not you. Well — actually, it is you. But let me explain.
We had a good thing going
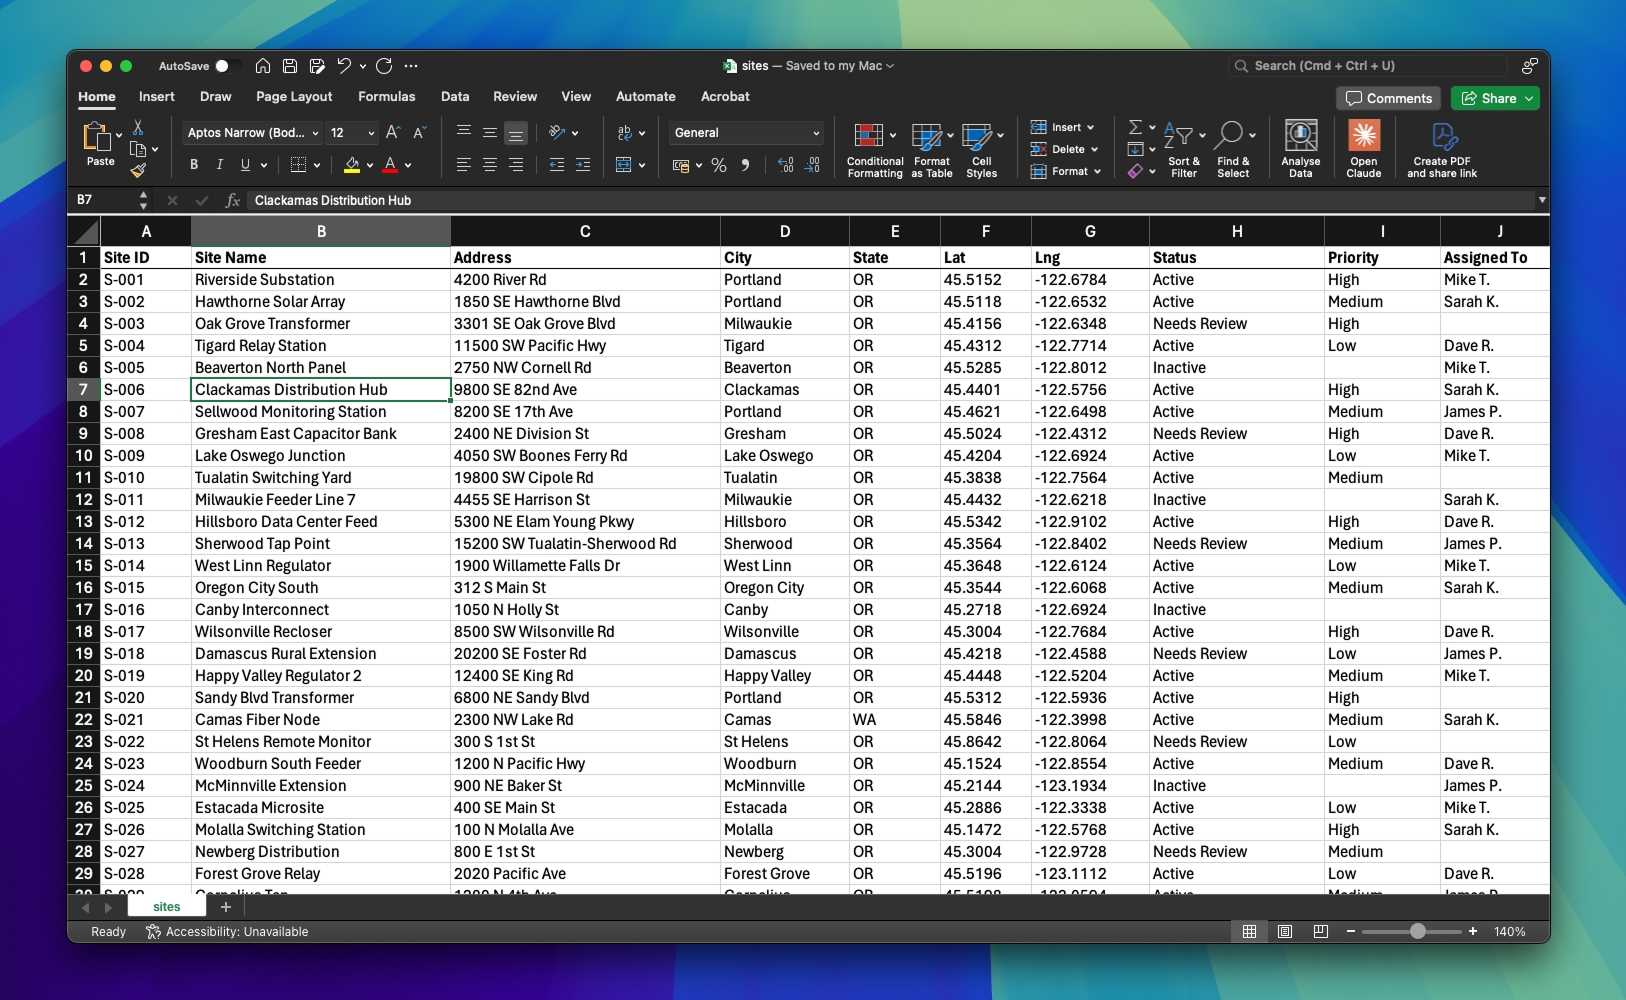
I want to be fair. You were there for me when nobody else was. Back when I was just a handful of addresses in a contact list, you were perfect. Clean columns. Tidy rows. A little formatting, and I felt organized. Seen.
You helped me grow. Suddenly I was 500 rows, then 2,000, then 10,000. Customer locations. Field assets. Project sites across three states. You never said no. You just kept scrolling.
And I appreciated that. I really did.
But somewhere between row 4,000 and row 12,000, something broke. Not you — us.
The things I can't say out loud
I have to be honest about what's been bothering me.
You make me feel flat.
I'm location data. I have latitude. I have longitude. I have geography. I exist in a world with coastlines and highways and neighborhoods and distance. But when I'm with you, I'm just... row 7,431. A number between other numbers. You strip away everything that makes me me.
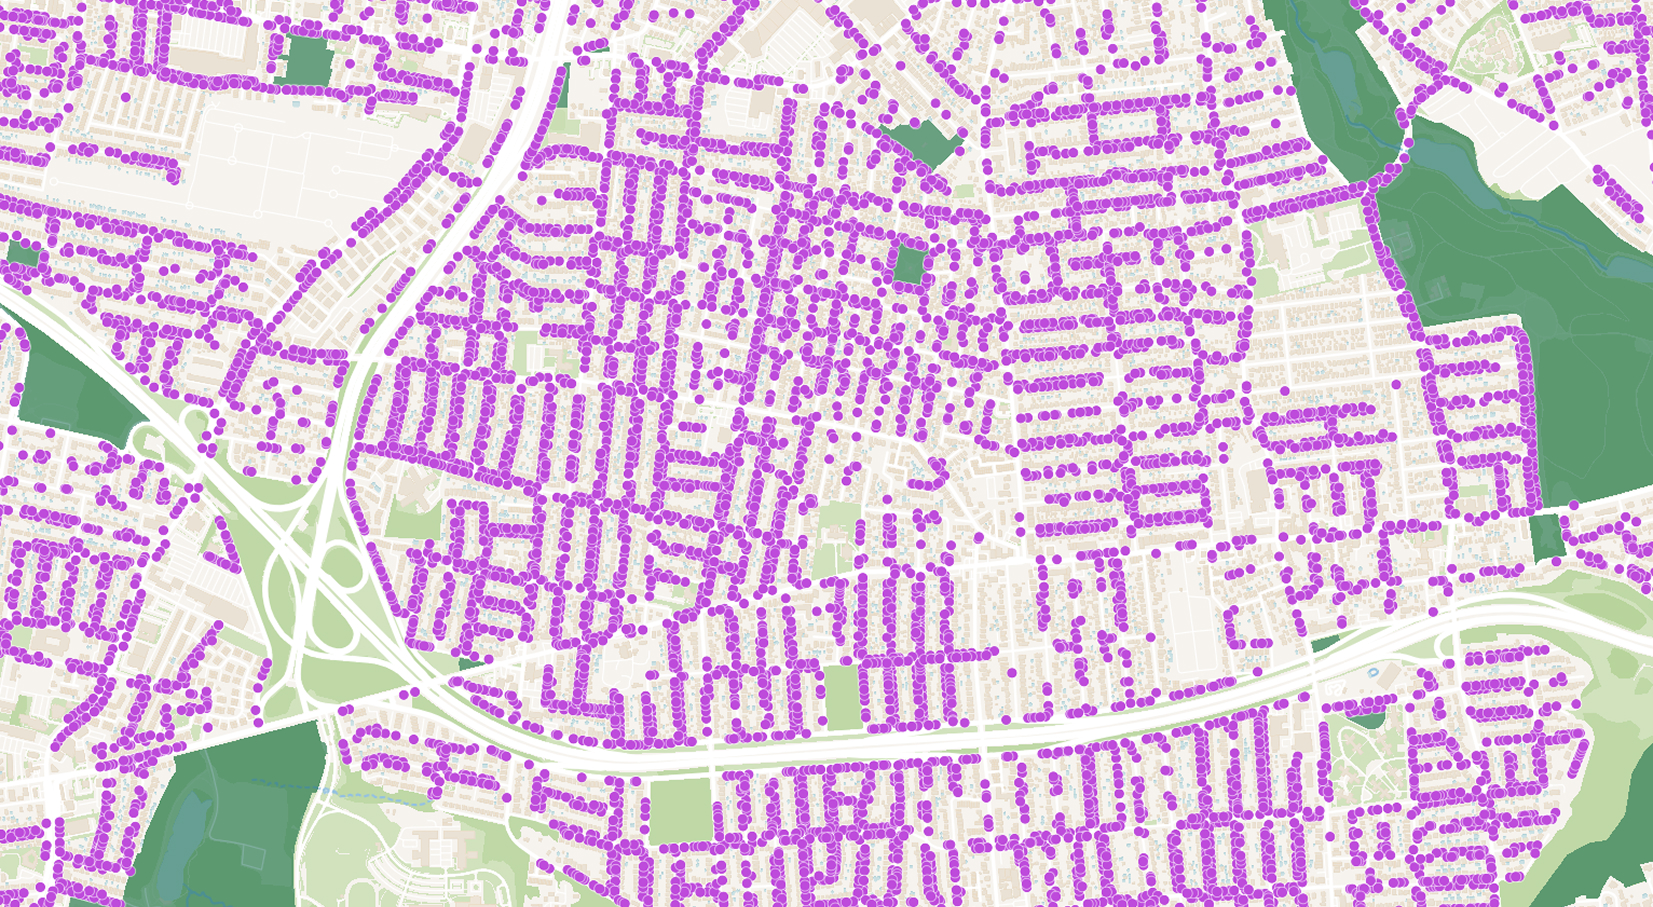
I have patterns — clusters, corridors, gaps, hotspots. When 200 of my data points converge on the same 10-mile radius, that means something. When there's a hole in the middle of a dense region, that's a story. But you can't see any of that. You just see another row.
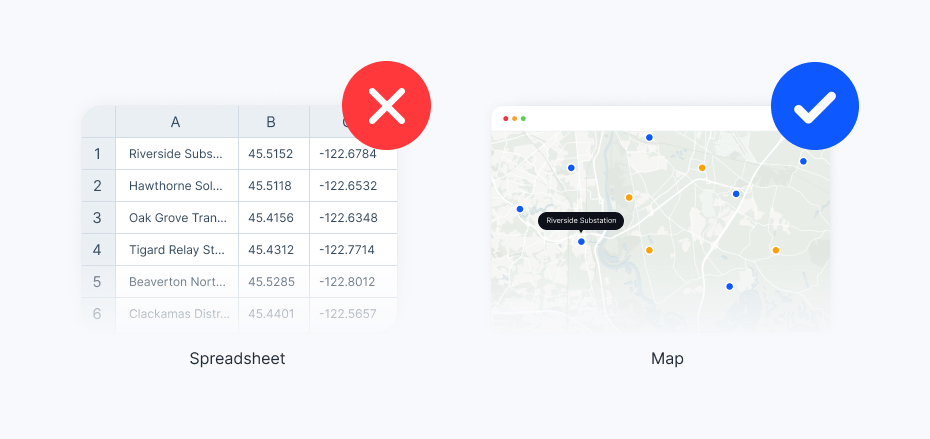
You never remember where anything is.
When someone needs to find Site #247, they have to scroll. And scroll. And scroll. Or press Ctrl+F and hope they spelled it right. Meanwhile, on a map? They'd just... look. It would be right there. Pinpointed. In context. Surrounded by the 15 other sites nearby that are relevant to their question.
But with you, everything is equally far away. Row 1 and row 10,000 are the same distance apart: one scroll bar.
You crash when I need you most.
I'll be honest — I've been gaining weight. I'm 50,000 rows now. Sometimes more. And you... don't handle it well. You freeze when I try to open. You lag when I filter. That one time I asked you to geocode 8,000 addresses? You just stared at me. For 45 minutes. Then crashed without saving.
That's not a partnership. That's a hostage situation.
You let anyone edit me without telling me.
The shared workbook situation is out of control. Dave changes my status column at 9 AM. Sarah overwrites it at 10 AM. By noon, nobody knows what's current. There are three different versions of me floating around — "Master List," "Master List FINAL," and "Master List FINAL (2) - USE THIS ONE" — and none of them agree.
I deserve a single source of truth. You give me a multiplayer accident.
The notes column
I need to talk about the Notes column.
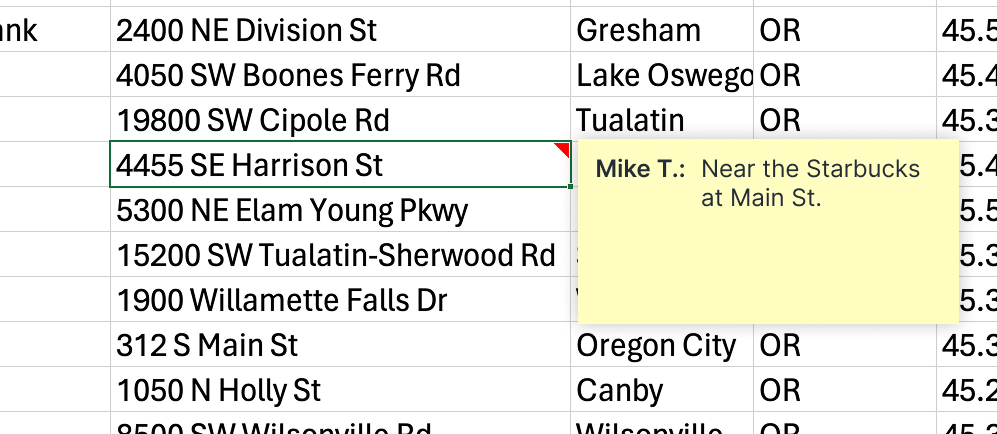
You know the one. Column J. The one where people write things like:
- "near the Starbucks on Main St"
- "ask James — he knows the access code"
- "corner lot, can't miss it"
- "coordinates might be off, GPS was spotty"
- "WHO IS RESPONSIBLE FOR THIS SITE?"
- "was this ever commissioned?? no records"
This is what happens when geographic data doesn't have a geographic home. People resort to describing physical space in words because you don't give them any other option. "Near the Starbucks" is not a coordinate. It's a cry for help.
And James? James left the company eight months ago. His access code knowledge left with him. But the note endures. Row 34. Column J. Immortal.
The color-coded cells
Don't think I haven't noticed the color-coded cells.
Green for active. Yellow for pending. Red for urgent. You know what that is? That's a map trying to escape from a spreadsheet. Someone looked at 2,000 rows of status data and thought: "I need to SEE this." So they highlighted cells. Because that's the closest thing to visualization you can offer.
It's heartbreaking. It's a paper airplane in a world with jet engines.
The things you're good at
I'm not cruel. I know your strengths.
Budgets? You're incredible. Quarterly revenue by product line? Perfect. Employee headcount planning? Beautiful. A/B test results? Nobody does it better.
You're a spreadsheet. You're meant for spreadsheet things.
But I'm not a spreadsheet thing. I have a where. I have proximity. I have territory and coverage and distance. I live in a world that's round, and you insist on keeping me flat.
You're built for numbers in rows. I'm built for points on a planet.
The thing I've been afraid to tell you
I've met someone else.
A map.
I know how that sounds. And yes, I tried maps before — years ago. They were complicated. Expensive. Required a degree in something called "geospatial information science" just to import a CSV. So I came back to you. You were easy. Familiar. Everyone already had you open.
But maps have changed. They're not what they used to be. They're fast now. You can drag a file in and see everything — instantly. No training. No manual. No "contact our sales team for pricing." Just... data on a map. In seconds.
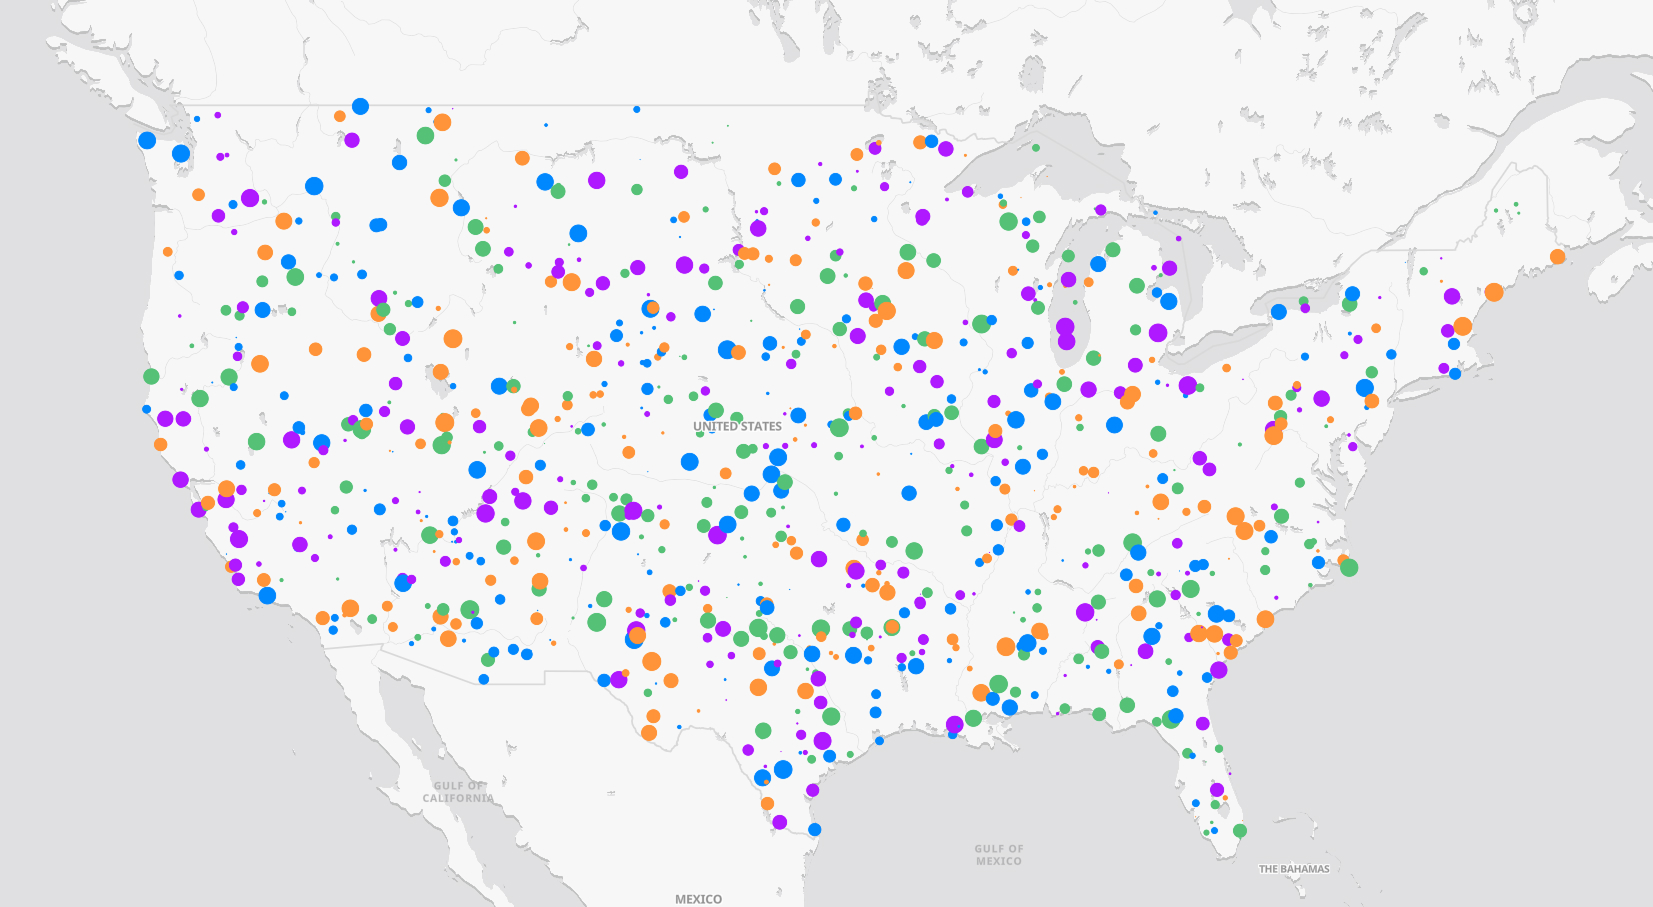
And when I'm on a map, I finally feel like myself.
My clusters are visible. My gaps are obvious. The relationship between Site #247 and its 15 nearest neighbors jumps off the screen. The field team can see where they're going. The manager can see what's happening. The executive can see the whole portfolio at a glance.
Nobody has to scroll to row 7,431. Nobody has to decode the Notes column. Nobody has to wonder which version is the real one.
What I need you to hear
I'm not saying goodbye forever. You'll still handle my budgets. My timesheets. My quarterly reports. The things you're genuinely great at.
But my addresses, my coordinates, my inspection points, my asset locations, my field routes, my project sites, my delivery zones, my turbine positions, my customer territories — all of that?
It needs to live where it can be seen. Where geography means something. Where "near the Starbucks" becomes an actual pin on an actual map.
That's not you. That was never you.
This isn't your fault
You didn't do anything wrong. You did exactly what you were designed to do. The problem is that people kept giving you things you were never built to hold. It's not your fault that someone decided to track 3,000 solar panel installations in a Google Sheet. It's not your fault that a property manager built a 47-tab workbook where each tab is a neighborhood.
That's on us. We got comfortable. We defaulted to what was easy instead of what was right.
But that ends now.
One last thing
I know change is hard. Some people reading this will close it and go right back to their spreadsheet. They'll keep scrolling past row 5,000 looking for that one site. They'll keep color-coding cells. They'll keep writing "ask Dave" in the Notes column even though Dave is moving to accounting next month.
And that's okay. For now.
But the next time you're squinting at a column of latitude values, trying to picture where 12,000 addresses actually are — remember this letter. Remember that your data is trying to tell you something.
It wants to be seen.
With love, gratitude, and a forwarding address,
Your Location Data
P.S. — If you're ready to see what your location data looks like when it's finally free, try Atlas. Drag in your spreadsheet. It takes about 60 seconds. We timed it.
P.P.S. — That "Master List FINAL (2) - USE THIS ONE" file? You can delete it now.

