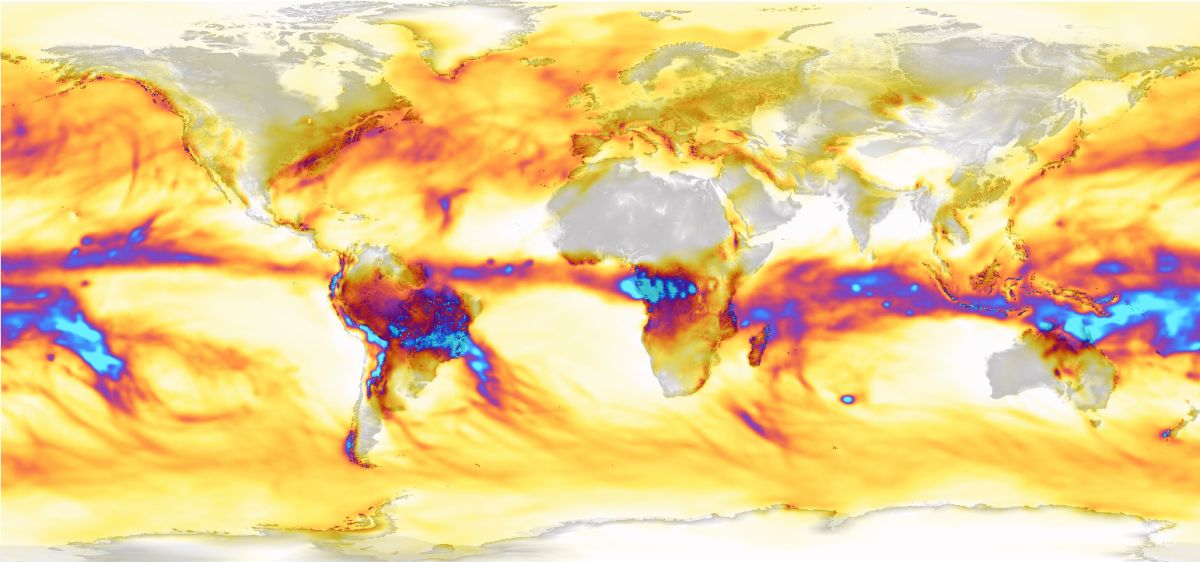
CHELSA stands for Climatologies at High resolution for the Earth's Land Surface Areas. It is a high-resolution climate dataset used to study environmental and geographic phenomena. CHELSA provides monthly and annual climatologies for temperature and precipitation at a very fine resolution, which makes it particularly valuable for a wide range of applications from biodiversity studies to climate change assessments.
CHELSA is crucial in filling the gaps left by traditional climatology data which often operates on a much coarser spatial scale. By offering detailed climatic maps, CHELSA serves as an important tool for researchers who require precise environmental data to conduct more granular analyses of climatic impacts on ecosystems and human activities.
The Importance of High-Resolution Climate Data
Climatic data at a high resolution allows scientists and researchers to analyze climate patterns and their impacts more accurately. This level of detail is essential for:
-
Biodiversity Studies: Understanding how different species interact with varied climates, often relying on the intricate details that high-resolution data such as that from CHELSA can provide.
-
Agricultural Planning: Farmers and agricultural planners can use this data to forecast climatic impacts on crops and adjust practices accordingly.
-
Urban Planning and Infrastructure: Cities can plan better by predicting rainfall patterns and temperature variations, helping in designing resilient infrastructure.
-
Conservation Efforts: Conservationists can identify areas that are more vulnerable to climatic changes and formulate strategies to mitigate adverse effects on biodiversity.
How CHELSA Works
CHELSA uses downscaling methods to provide high-resolution climate data. Downscaling is the process of taking coarse-scale models of large climate systems and increasing their resolution to provide more detailed information at a smaller scale. CHELSA’s approach involves climatological data interpolation which includes topographical corrections to simulate how mountains, valleys, and other geographical features influence climate.
Applications in GIS Platforms
Geographic Information Systems (GIS) play a pivotal role in visualizing CHELSA data. By integrating CHELSA datasets into GIS platforms, users can create detailed maps that demonstrate climate trends and patterns pertinent to their field of study. Here’s how CHELSA is utilized within GIS environments:
- Data Layering: Combine CHELSA data with other geographic or spatial datasets to analyze correlations between climate and geospatial variables.
- Predictive Analysis: Using CHELSA data, GIS tools can simulate future climatic scenarios, aiding in planning and decision-making.
- Interactive Mapping: Platforms like Atlas can build interactive visualizations that allow stakeholders to explore complex datasets easily.
Featured GIS Tools Supporting CHELSA
Several GIS tools support high-resolution spatial data integration like CHELSA:
-
QGIS: As a powerful open-source GIS tool, QGIS allows users to import CHELSA data and perform spatial analyses, leveraging its robust plugin ecosystem.
-
GRASS GIS: Known for its strong analytical capabilities, GRASS GIS can handle large datasets and provides tools for environmental modeling using detailed climatic data.
-
Google Earth Engine: This cloud-based platform can be used to analyze CHELSA datasets, offering powerful computing capabilities for large-scale environmental data processing.
Impact of CHELSA on Climate Research
The release of CHELSA has revolutionized the way climatic data is utilized across various sectors. It not only broadens the horizon for academic research but also empowers practitioners and policymakers with data-driven insights for better decision-making. As climate dynamics continue to evolve, having access to detailed, accurate, and current climatic data becomes imperative for sustainable development and environmental stewardship.
Challenges and Considerations
Despite its advantages, the use of high-resolution climate data like CHELSA comes with challenges:
- Data Management: Handling large volumes of data requires sophisticated infrastructure and software capabilities.
- Understanding and Interpretation: Users need to be well-versed in spatial data analysis to accurately interpret complex datasets.
- Integration with Existing Systems: There can be compatibility issues when integrating CHELSA data with existing systems or datasets that operate on different scales or formats.
How Atlas Supports CHELSA Data Integration
Atlas offers a versatile platform that simplifies the integration and analysis of high-resolution climate data like CHELSA. With its user-friendly interface and powerful capabilities, Atlas allows users to harness the full potential of CHELSA data for various climatological applications.
Seamless Data Integration
Atlas supports a wide range of data formats and provides tools to easily integrate CHELSA datasets into your projects. By doing so, users can overlay CHELSA data with other spatial datasets, creating rich maps that offer comprehensive insights into climate trends.
Accessible from Anywhere
One of the standout features of Atlas is its web-based nature. This means researchers, planners, and decision-makers can access and manipulate CHELSA data right from their browsers. This accessibility removes traditional barriers of needing complex installed software, making high-resolution climate data available to a wider audience.
Interactive and Collaborative
Atlas isn't just about creating static maps. It empowers users to build interactive visualizations that stakeholders can explore. Moreover, its collaborative features allow teams to work together in real-time — essential for projects requiring input from diverse groups, from climate researchers to urban planners.
Customization and Analysis Tools
With Atlas, users can perform complex spatial analyses without a steep learning curve. Its intuitive tools allow users to customize visual styles, perform analyses, and interpret CHELSA data efficiently. This feature is particularly beneficial for visualizing and understanding how climate data interacts with other environmental variables.
Practical Applications
From urban planning to biodiversity studies and conservation efforts, Atlas provides a platform where the intricate details of CHELSA data can be used to draw actionable insights. Users can adjust visualization parameters to highlight specific aspects of climate data, such as temperature variations or precipitation trends, to inform decision-making processes effectively.
Through Atlas, accessing, analyzing, and visualizing CHELSA data becomes a streamlined process, opening doors to deeper insights and enabling informed interventions in climate-related challenges. Whether you're assessing climate impacts on biodiversity or planning sustainable urban growth, Atlas equips you with the necessary tools to make sense of complex datasets and empower your projects with data-driven decisions.

