Create hazard maps
Map risk zones effectively with Atlas’ intuitive hazard mapping tools

What is a hazard map?
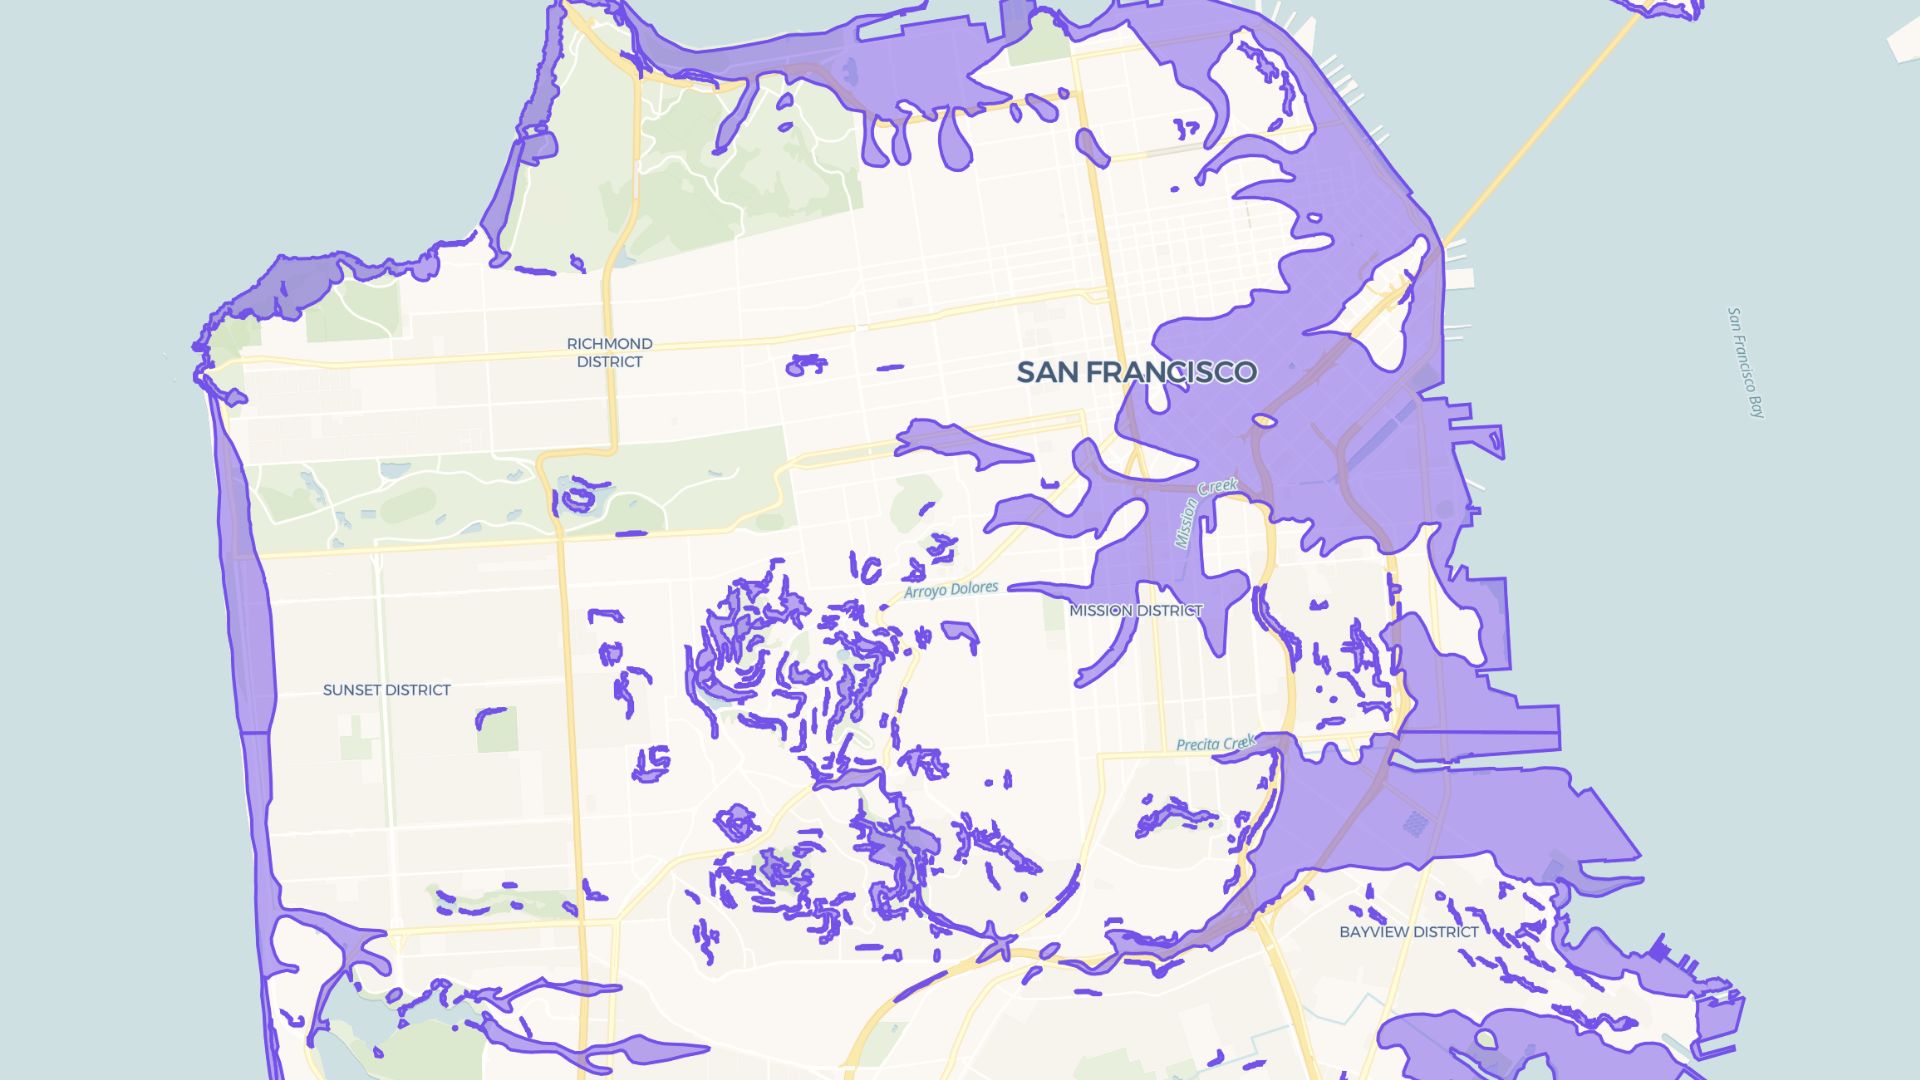
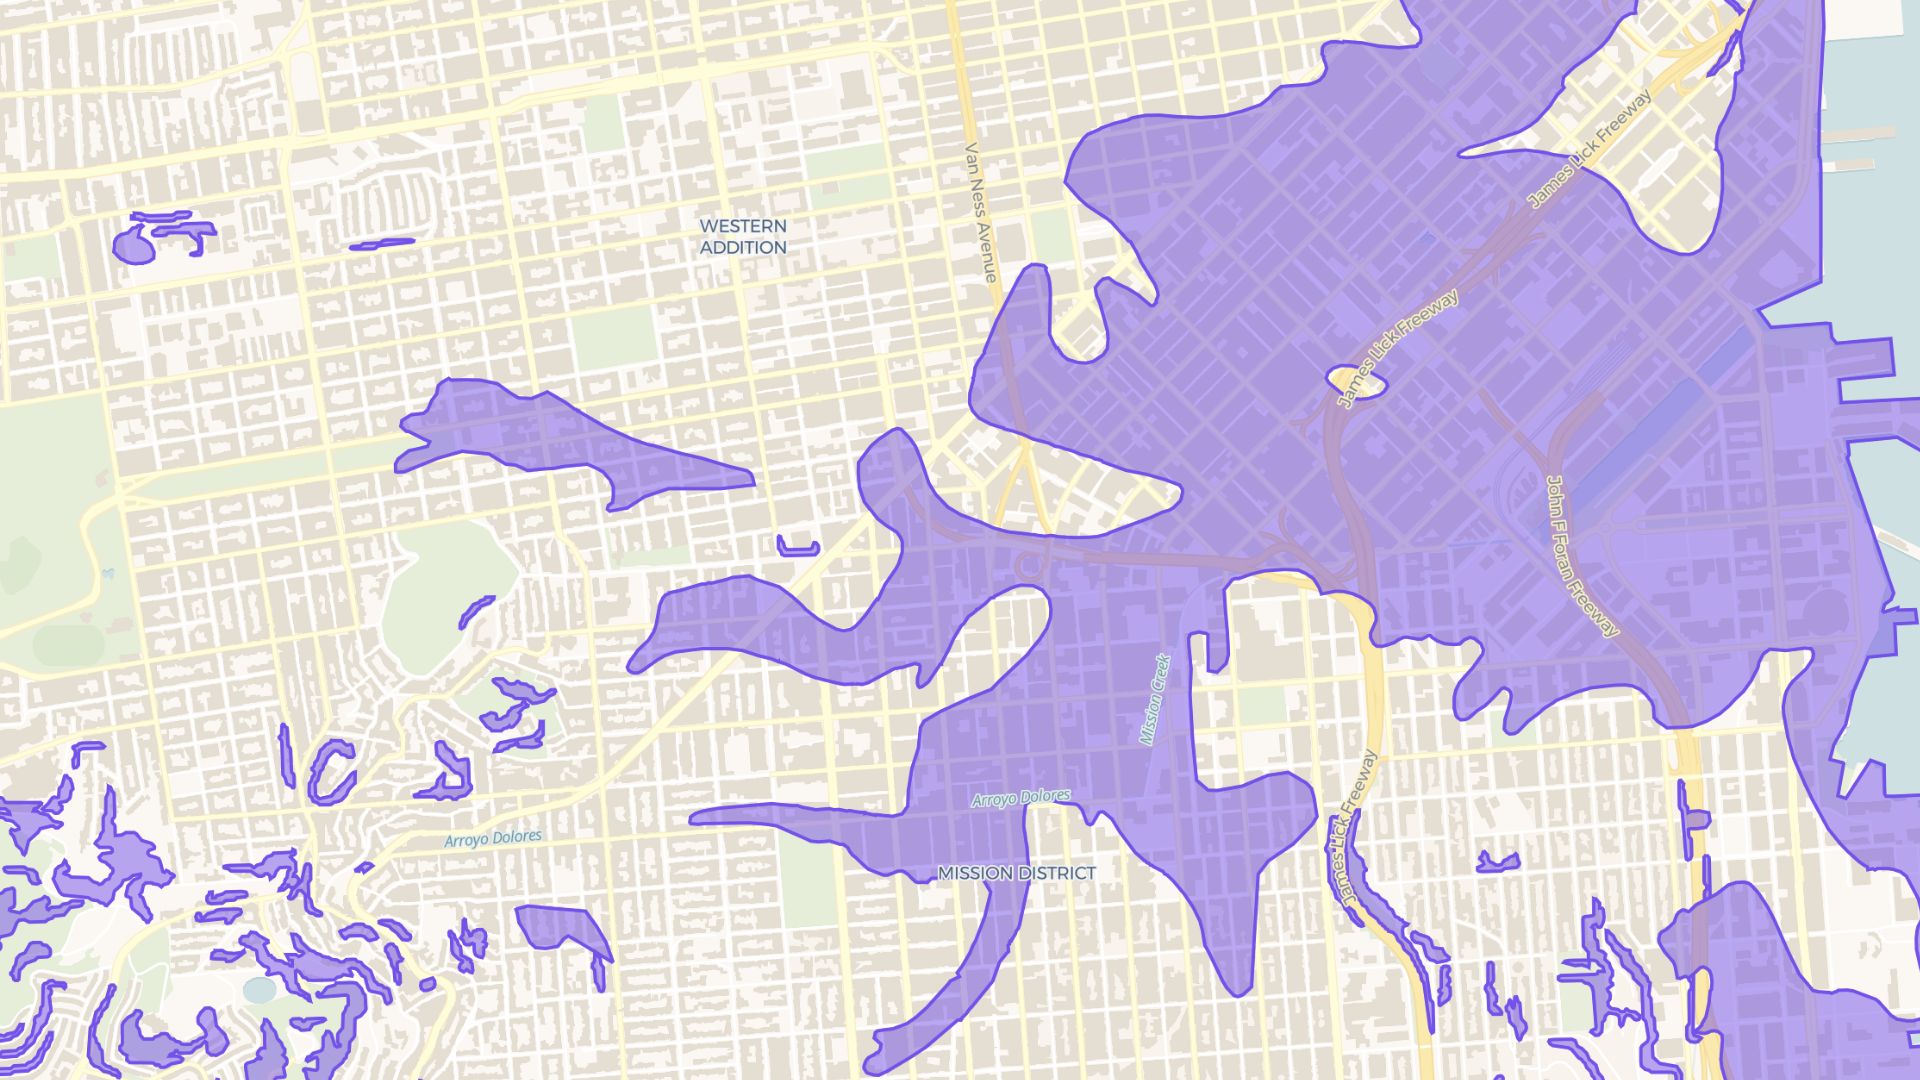
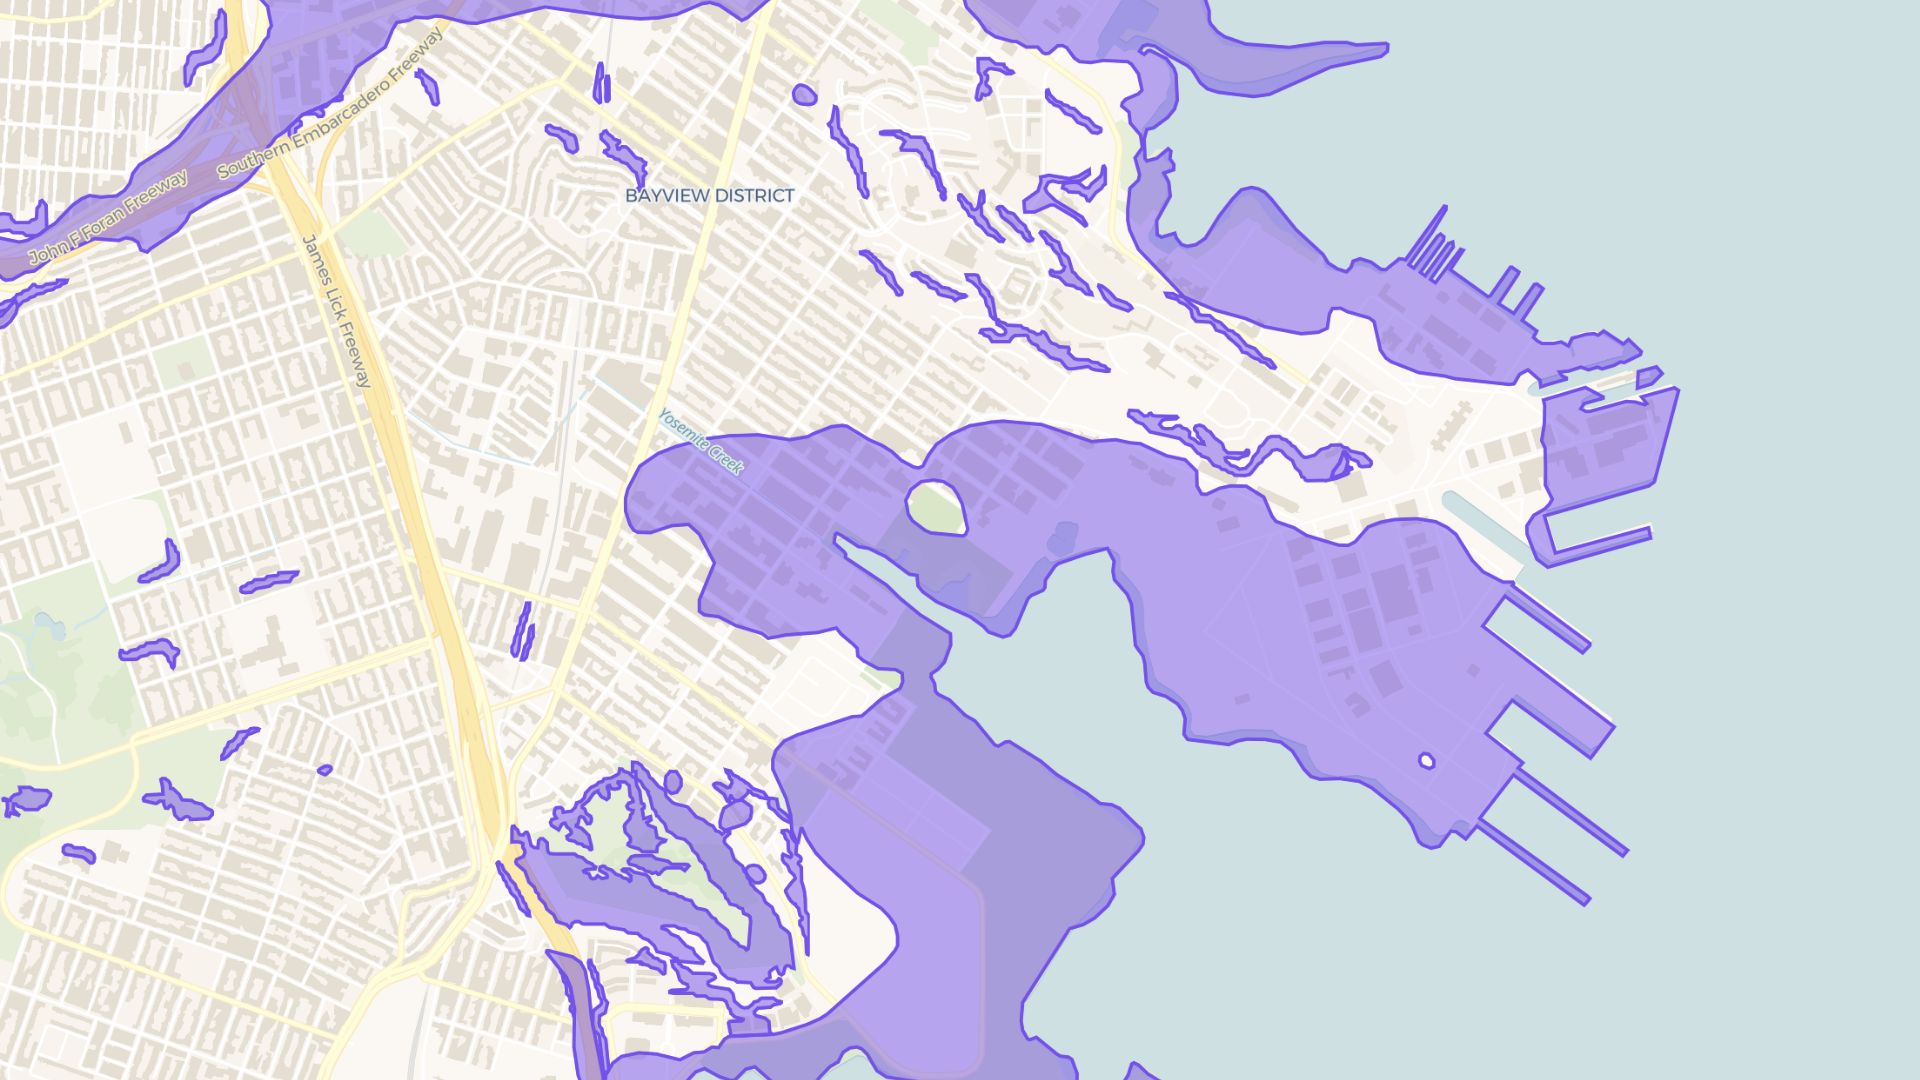
A hazard map shows areas prone to risks like floods, earthquakes, or fires. These maps help organizations and governments plan safety measures, prepare responses, and communicate risks to affected populations.
Create your first hazard map

Examples of hazard maps
Flood risk areas
Highlight flood-prone zones to prepare for natural disasters
Wildfire hotspots
Map out areas with high fire risks to plan response measures
Earthquake vulnerability
Identify earthquake-prone regions to prioritize infrastructure safety
How to create hazard maps?
Import risk data
Upload data on hazards, such as past incidents or vulnerability indices.
Define hazard categories
Group risks by type (e.g., floods, fires) and assign color codes.
Overlay with other layers
Add population density, infrastructure, or land-use layers.
Publish and share
Save the map and share it with stakeholders for planning and awareness.
Why choose Atlas for hazard maps?
Atlas simplifies hazard mapping with advanced tools for analysis and sharing.
Real-time updates
Integrate live weather or risk data for up-to-date maps.
Custom legend creation
Create legends tailored to your specific risks.
Multilayer analysis
Combine hazard maps with socioeconomic data.
Interactive sharing
Publish maps online for public or team access.
Offline support
Export maps for offline use in remote areas.
Custom alerts
Set notifications for specific risk levels in designated areas.
Frequently asked questions
Learn more about creating and using hazard maps.
