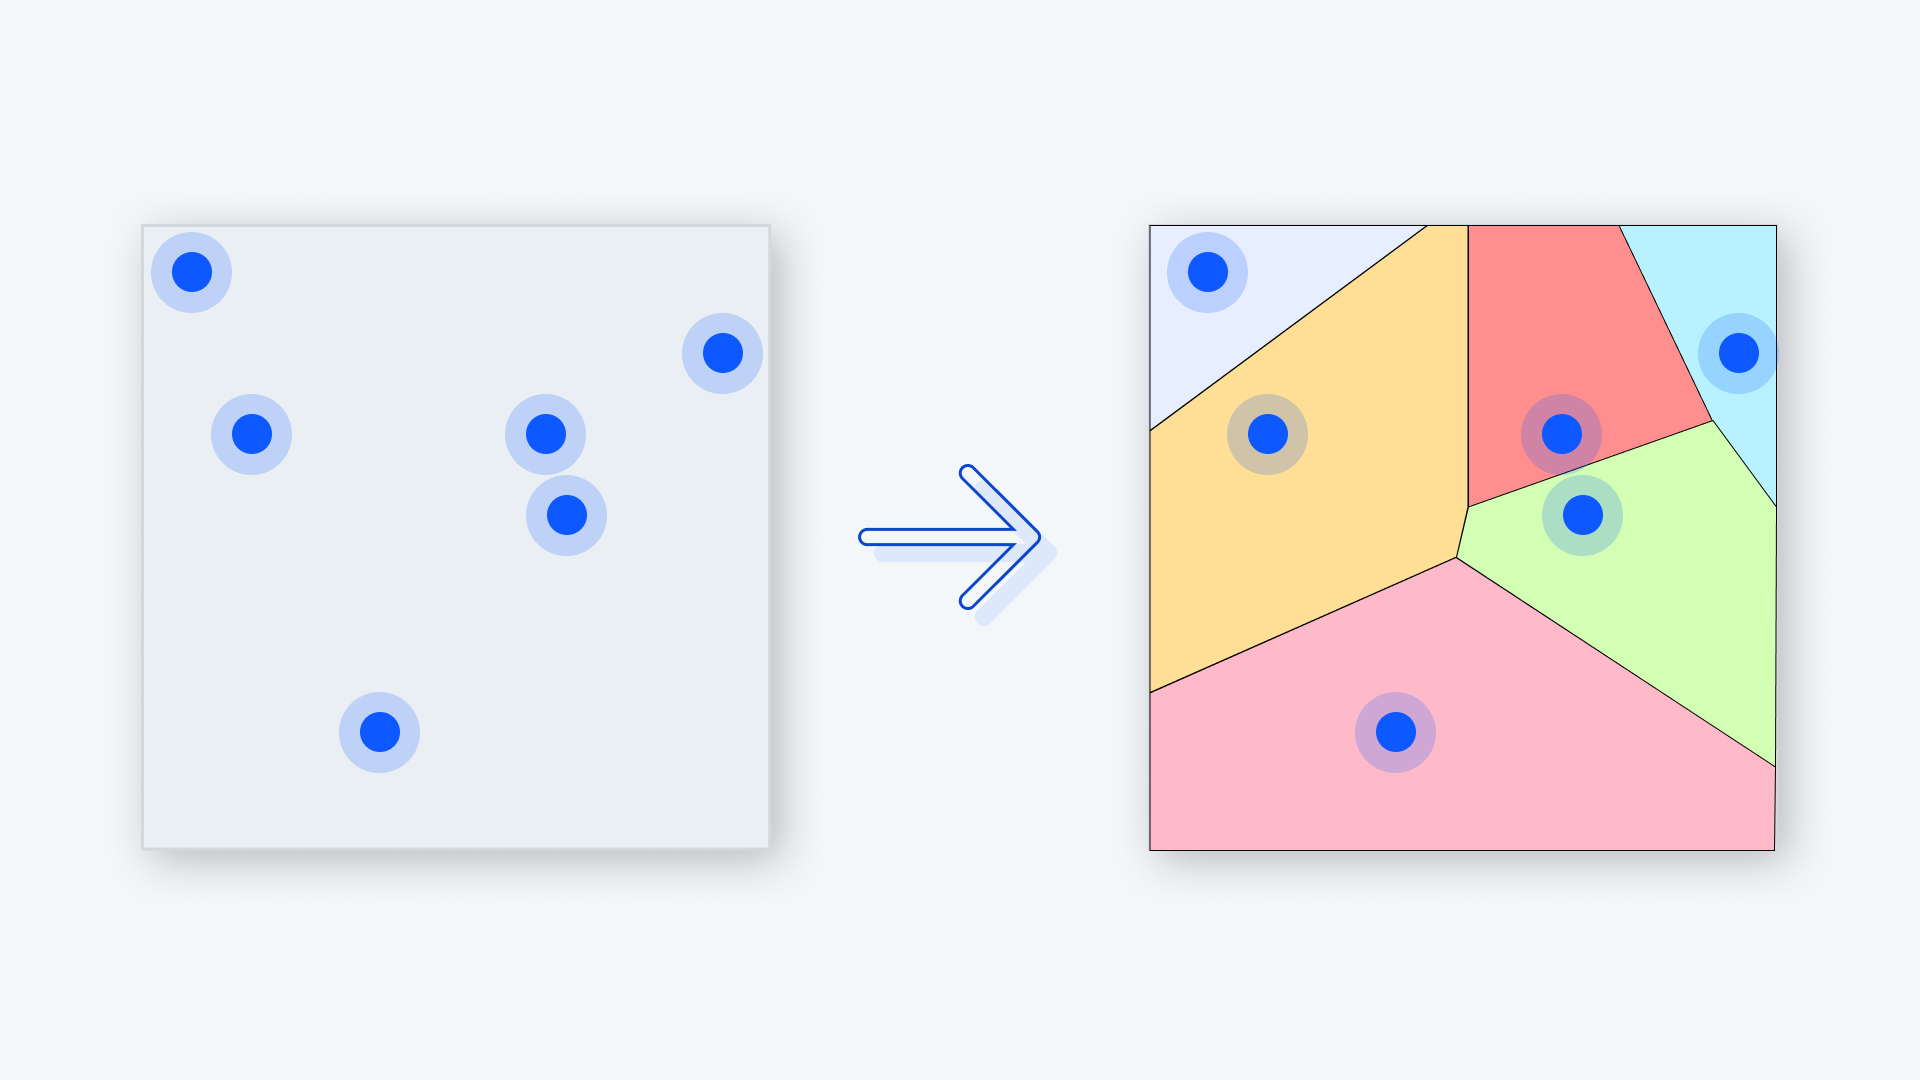
Thiessen polygons, also known as Voronoi diagrams, are a popular method in Geographic Information Systems (GIS) for partitioning spaces based on proximity to a set of points. These polygons help visualize areas closest to a specific location and are widely used in spatial analysis.
What Are Thiessen Polygons?
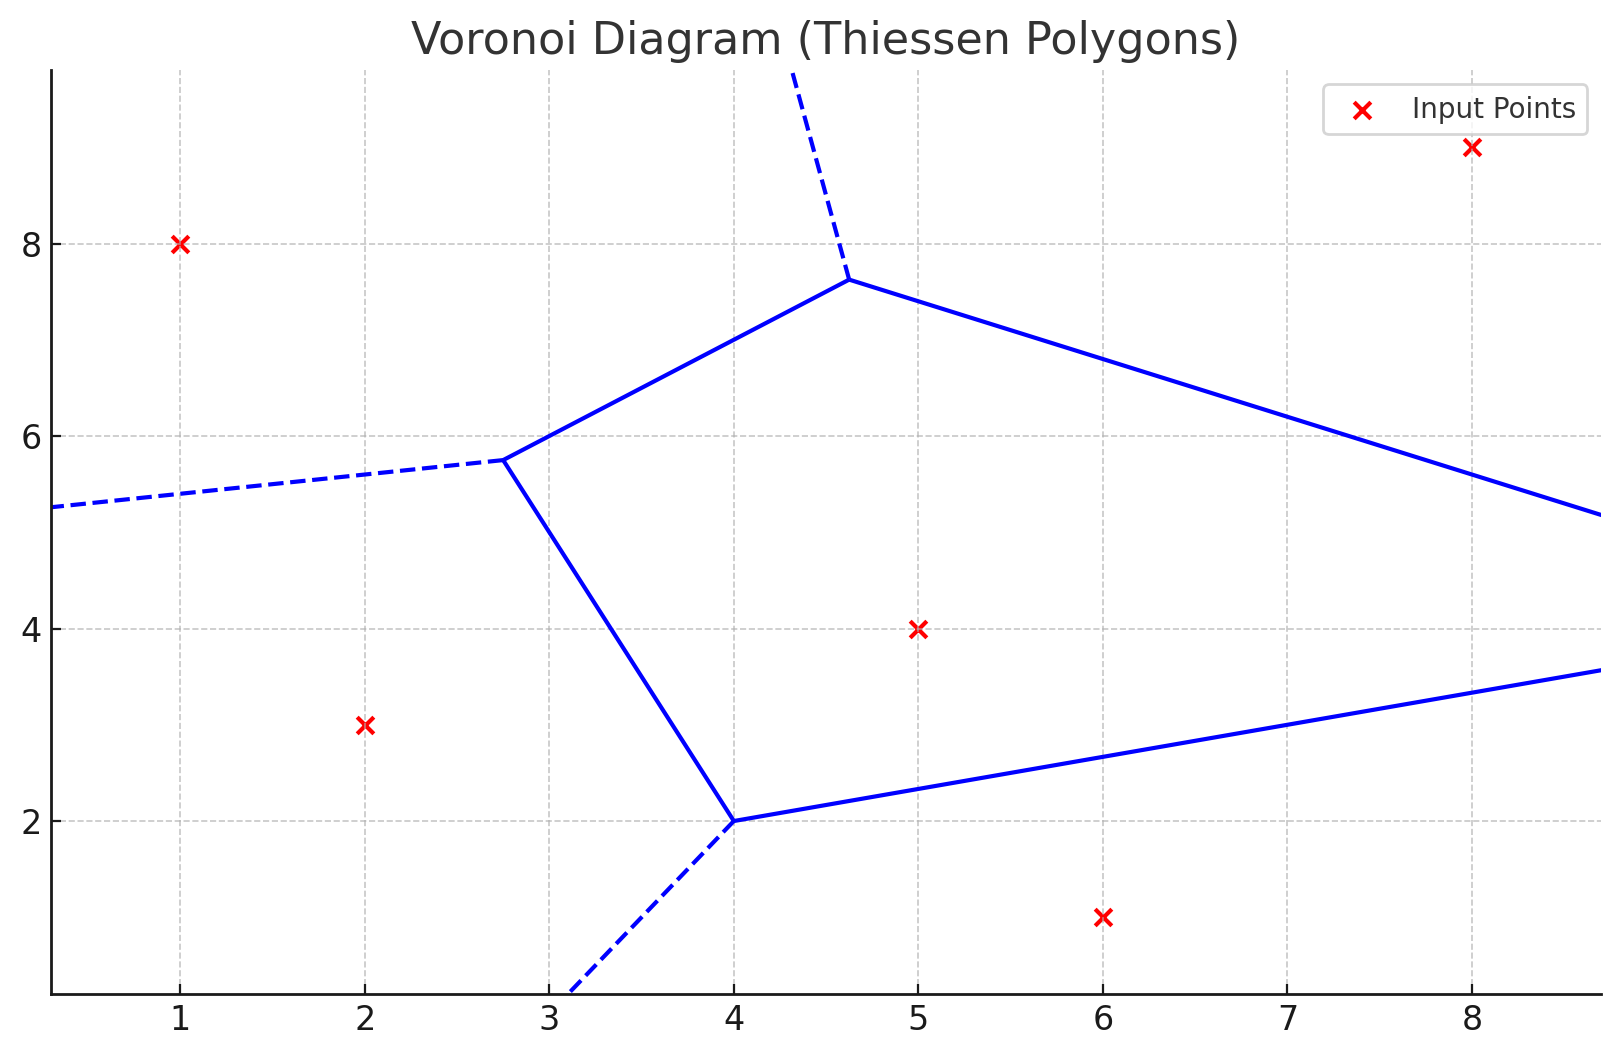
At their core, Thiessen polygons divide a plane into regions where every point within a given polygon is closer to its associated data point than to any other. For example, given a set of weather stations, Thiessen polygons can delineate the area most likely influenced by each station.
How Are They Used?
Thiessen polygons have a broad range of applications, spanning from urban planning to natural resource management. Below are some key use cases:
1. Environmental Monitoring
Environmentalists use Thiessen polygons to study climate patterns. For instance, they can map rainfall distribution based on data from weather stations.
2. Market Area Analysis
Businesses use these polygons to define trade areas. By understanding which location is most accessible to potential customers, they can optimize store placement.
3. Emergency Services Planning
Thiessen polygons are vital for planning emergency services. They help define service zones, ensuring efficient response times.
4. Agriculture
In agriculture, they help map the influence zones of irrigation systems or study pest distribution.
5. Telecommunications
Telecommunication companies use Thiessen polygons to design cell tower coverage areas, ensuring optimal connectivity.
Tools for Creating Thiessen Polygons
Creating Thiessen polygons is simpler than it seems, especially with modern GIS platforms. Here's how to get started:
1. Browser-Based Platforms
Tools like Atlas offer intuitive ways to create Thiessen polygons. These platforms operate in a browser, allowing seamless data uploads and analysis.
2. Dedicated GIS Software
Software like QGIS or ArcGIS includes functions to generate Thiessen polygons. These are suitable for more advanced users needing detailed customization.
3. Programming
For coders, libraries in Python (e.g., SciPy) and R can generate Voronoi diagrams. This approach provides more control but requires programming skills.
import numpy as np from scipy.spatial import Voronoi, voronoi_plot_2d import matplotlib.pyplot as plt from shapely.geometry import PolygonStep 1: Define Points (as coordinates)
points = np.array([ [2, 3], [5, 4], [1, 8], [6, 1], [8, 9] ])
Step 2: Generate Voronoi Diagram
vor = Voronoi(points)
Step 3: Visualize Voronoi Diagram (optional)
voronoi_plot_2d(vor) plt.scatter(points[:, 0], points[:, 1], color='red') # Plot input points plt.title("Voronoi Diagram (Thiessen Polygons)") plt.show()
Step 4: Convert Voronoi Regions to Polygons
def voronoi_to_polygons(vor): """Convert Voronoi diagram regions into polygons.""" polygons = [] for region_index in vor.regions: if not region_index or -1 in region_index: # Skip regions with no vertices or unbounded areas continue polygon = [vor.vertices[i] for i in region_index] polygons.append(Polygon(polygon)) return polygons
Generate Thiessen Polygons
thiessen_polygons = voronoi_to_polygons(vor)
Step 5: Visualize Polygons
for poly in thiessen_polygons: plt.plot(*poly.exterior.xy) plt.scatter(points[:, 0], points[:, 1], color='red') # Original Points plt.title("Thiessen Polygons") plt.show()

Creating Thiessen Polygons in Atlas
With Atlas, a browser-based GIS platform, you can create Thiessen polygons in a few simple steps:
- Upload Data: Start by uploading your dataset containing the point locations (e.g., weather stations, stores). Alternatively, generate random points within a polygon to test the process.
- Navigate to Thiessen Polygon Analysis (Voronoi Polygon Analysis)
- Analyze: Overlay additional data to analyze patterns and relationships.
- Share and Collaborate: Share your interactive maps with team members or stakeholders for further analysis.
Real-World Example: Thiessen Polygons in Urban Planning
Imagine a city planning department looking to optimize public services like libraries or hospitals. By creating Thiessen polygons for existing facilities, planners can identify underserved areas and make data-driven decisions on where to build new ones.
This method is efficient, requiring minimal data inputs but providing clear, actionable insights.
Why Use Thiessen Polygons?
The simplicity and effectiveness of Thiessen polygons make them a go-to method for spatial partitioning. They don’t require complex datasets and can be applied to numerous fields. Moreover, tools like Atlas streamline the creation process, making GIS accessible to everyone.
Thiessen polygons offer a clear view of spatial relationships. They’re indispensable for anyone looking to analyze proximity, optimize resources, or better understand geographic patterns.
With platforms like Atlas, creating and leveraging Thiessen polygons has never been easier. Start exploring today and unlock the power of spatial analysis.


