
Have you ever wondered how we fit our round Earth onto flat maps or computer screens? Here's the secret - we use a method known as map projections.
What is a map projection?
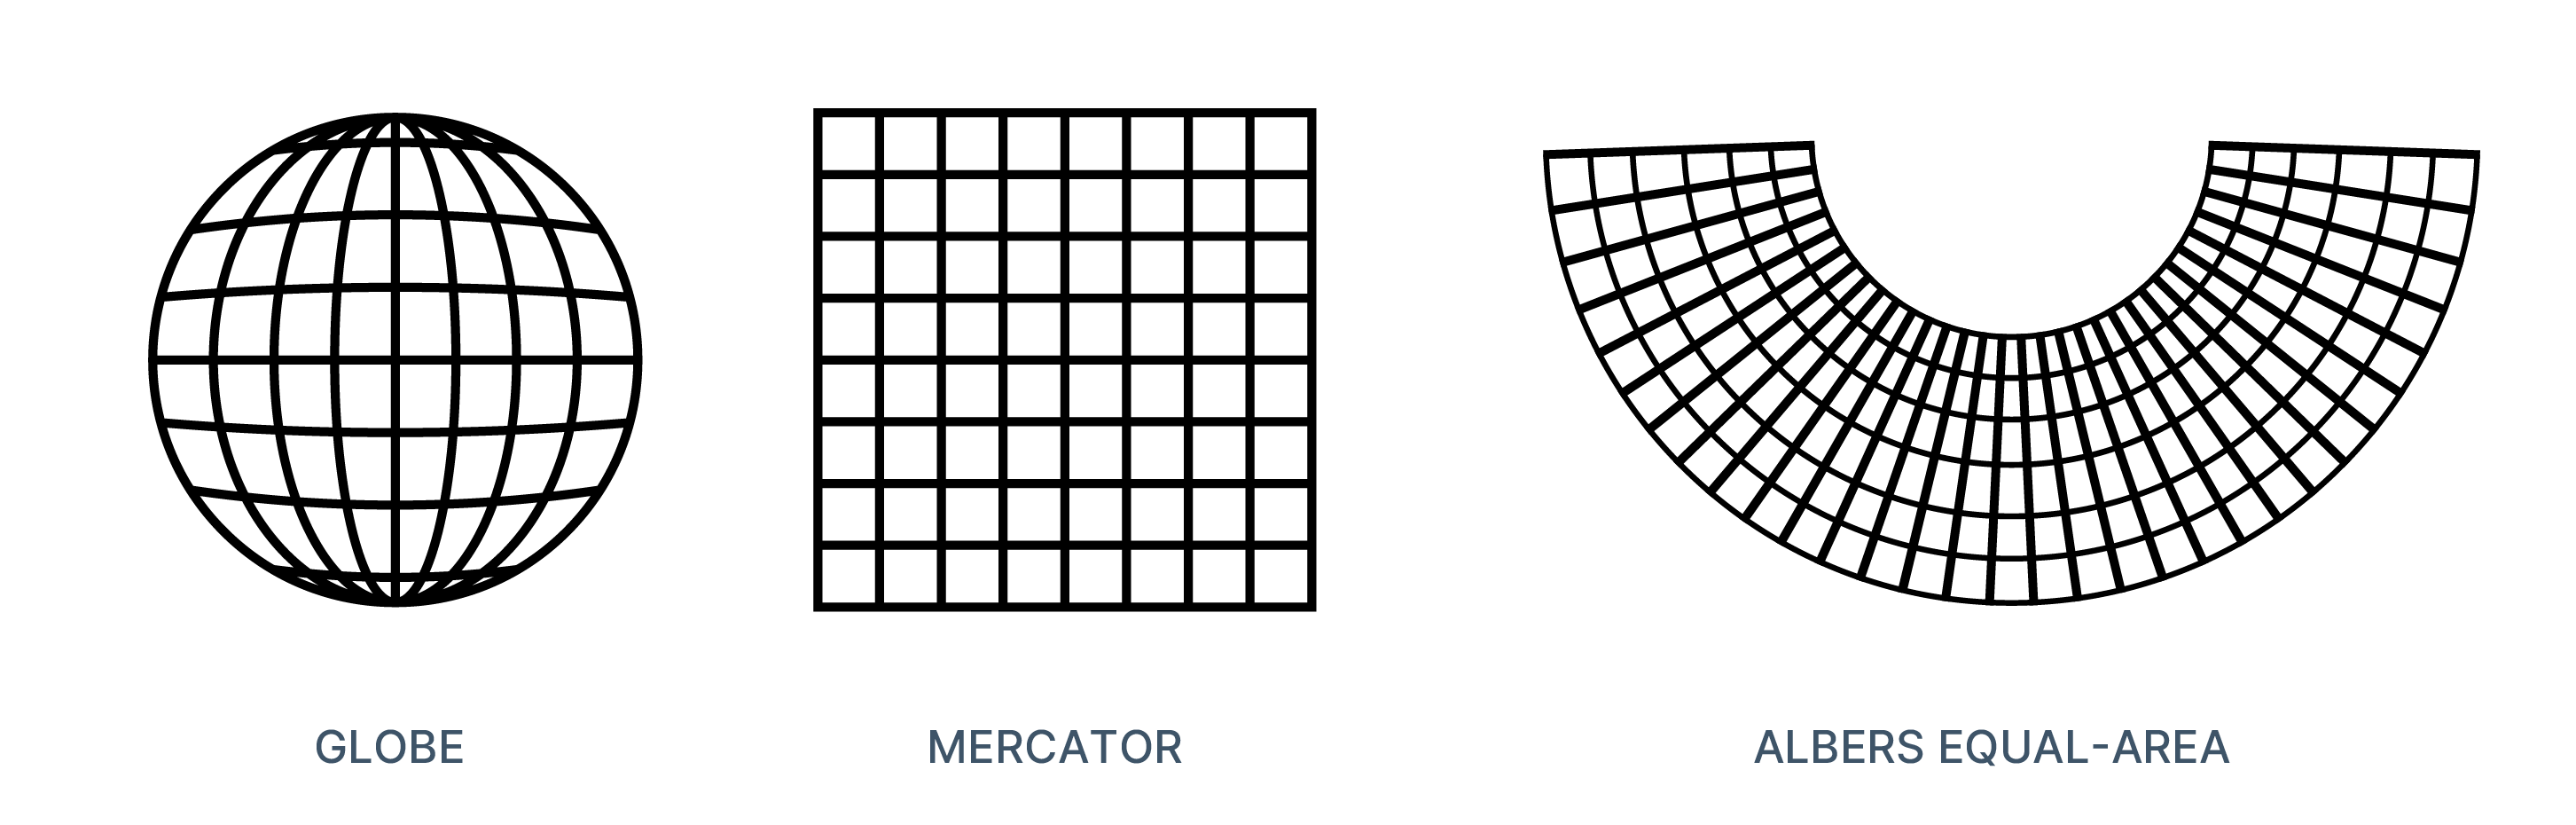
In simple words, a map projection is a way to flatten the Earth's surface. It's like peeling an orange and trying to flatly lay out the peel.
Now if you've ever made a map, you've actually used these projections. They work by transforming our usual latitude and longitude into 'flat' coordinates known as Cartesian coordinates.
But there's a catch to it. Since the Earth isn't flat (it's more like a slightly squashed ball), when we try to flatten it, things get a bit distorted. These projections help us to minimize that distortion as much as possible while making our maps.
So how does all of this magic happen? Well, let's delve into the details!
The Projection Process
The process of projecting involves several steps:
- Datum Definition: A datum is used as a frame of reference, and defines the position of the ellipsoid relative to the Earth's center. Examples include NAD83 (North American Datum 1983) and WGS84. The choice of datum affects the accuracy and precision of the spatial data. Each datum represents a slightly different shape of the Earth, based on varying measurements and purposes.
- Transformation: Latitude and longitude coordinates are transformed to a flat plane using mathematical formulas. This step involves choosing a projection method that suits the map's purpose. This transformation requires complex calculations to translate the 3D coordinates onto a 2D plane.
- Adjustment for Scale and Distortion: All projections introduce some form of distortion—either in shape, area, distance, or direction. The choice of projection depends on which distortions can be tolerated and which characteristics need to be preserved. Different projections balance these distortions in various ways, aiming to minimize the impact based on the map's intended use.
Types of Projections
In a perfect world with a perfect sphere, we could have preserved everything when projecting the sphere to a map, but that is not the case. You cannot find a projections that perfectly map the 3D world to a 2D map - All projections distort the world in some way. Therefore, it exists different families of projections, based on what they preserve:
- Conformal Projections: Preserve angles and shapes over small areas. These are often used in navigation and meteorology because they accurately represent shapes and angles, which is important for directions. Example: Mercator projection.
- Equal-Area Projections: Preserve area, making them useful for comparing different regions. These are particularly valuable for thematic maps where accurate representation of area is important, such as population density or land use maps. Example: Albers Equal-Area projection.
- Equidistant Projections: Preserve distances from specific points or along specific lines. These projections are useful for applications where accurate distance measurements from a central point are essential, like radio broadcast range maps. Example: Equidistant Conic projection.
- Azimuthal Projections: Preserve direction from a central point. These are often used for polar charts and airline route maps because they accurately represent directions from the center point. Example: Stereographic projection.
Commonly Used Projections
Which type of projection that is used depends on the need for the map you are creating.
-
Mercator Projection
- Widely used for navigation because it preserves angles.
- Distorts size, especially near the poles, making Greenland appear much larger than it actually is compared to continents like Africa.
- The most common projection for web maps.
-
Albers Equal-Area Conic Projection
- Commonly used for maps of the United States.
- Preserves area, making it useful for thematic maps showing data like population density.
-
Universal Transverse Mercator (UTM)
- Divides the world into a series of zones.
- Minimizes distortion within each zone, making it suitable for detailed, large-scale mapping.
Why Projections Matter
Choosing the right projection is important because it affects how spatial data is represented and interpreted. The wrong projection can lead to significant misinterpretations, especially in projects involving distance, area, and spatial relationships.
How to Choose the Right Projection
- Purpose of the Map: Determine what you need to preserve (shape, area, distance, direction).
- Geographic Extent: Consider the area you are mapping. For global maps, use projections that handle larger extents well. For local maps, projections like UTM are more suitable.
- Data Characteristics: Understand the nature of your spatial data and how it will be used in analysis.
Practical Examples
- Navigational Maps: Use the Mercator projection because it preserves direction.
- Thematic Maps Showing Population Density: Use an equal-area projection like Albers Equal-Area Conic.
- Mapping a Small Region in Detail: Use UTM to minimize distortion within the zone.
How Atlas deal with projections
Most modern GIS software allows users to easily switch between different projections, and Atlas is no exception. However, we believe that creating great maps shouldn't require an extensive understanding of map projections. Therefore, users of Atlas don’t need to worry about selecting the right projection for their data. Atlas automatically transforms data to the most accurate projection for each specific task.
- Displaying Data: For displaying data, we rely on the Mercator projection, commonly used for web maps and popularized by services like Google Maps.
- Distance and Area Calculations: When performing distance and area calculations, we transform the data to the most accurate projection for the specific area being analyzed, typically using one of the UTM (Universal Transverse Mercator) zones. UTM zones are particularly effective because they minimize distortion over small areas, ensuring that our measurements are as accurate as possible.
- Spatial Analysis: For various forms of spatial analysis, we also transform data to the most suitable projection. This step is crucial for tasks like overlay analysis, buffering, and spatial interpolation, where precision can significantly impact results.
- Data Storage: To maintain spatial precision and ensure compatibility, we store data in standard latitude and longitude coordinates. This approach allows us to retain the inherent geographic properties of the data, making it easier to transform between projections as needed.
This flexibility is crucial for handling diverse datasets from various sources with different projections. By dynamically transforming data to the most appropriate projections for specific tasks, Atlas improves the accuracy and reliability of the spatial analyses and visualizations.