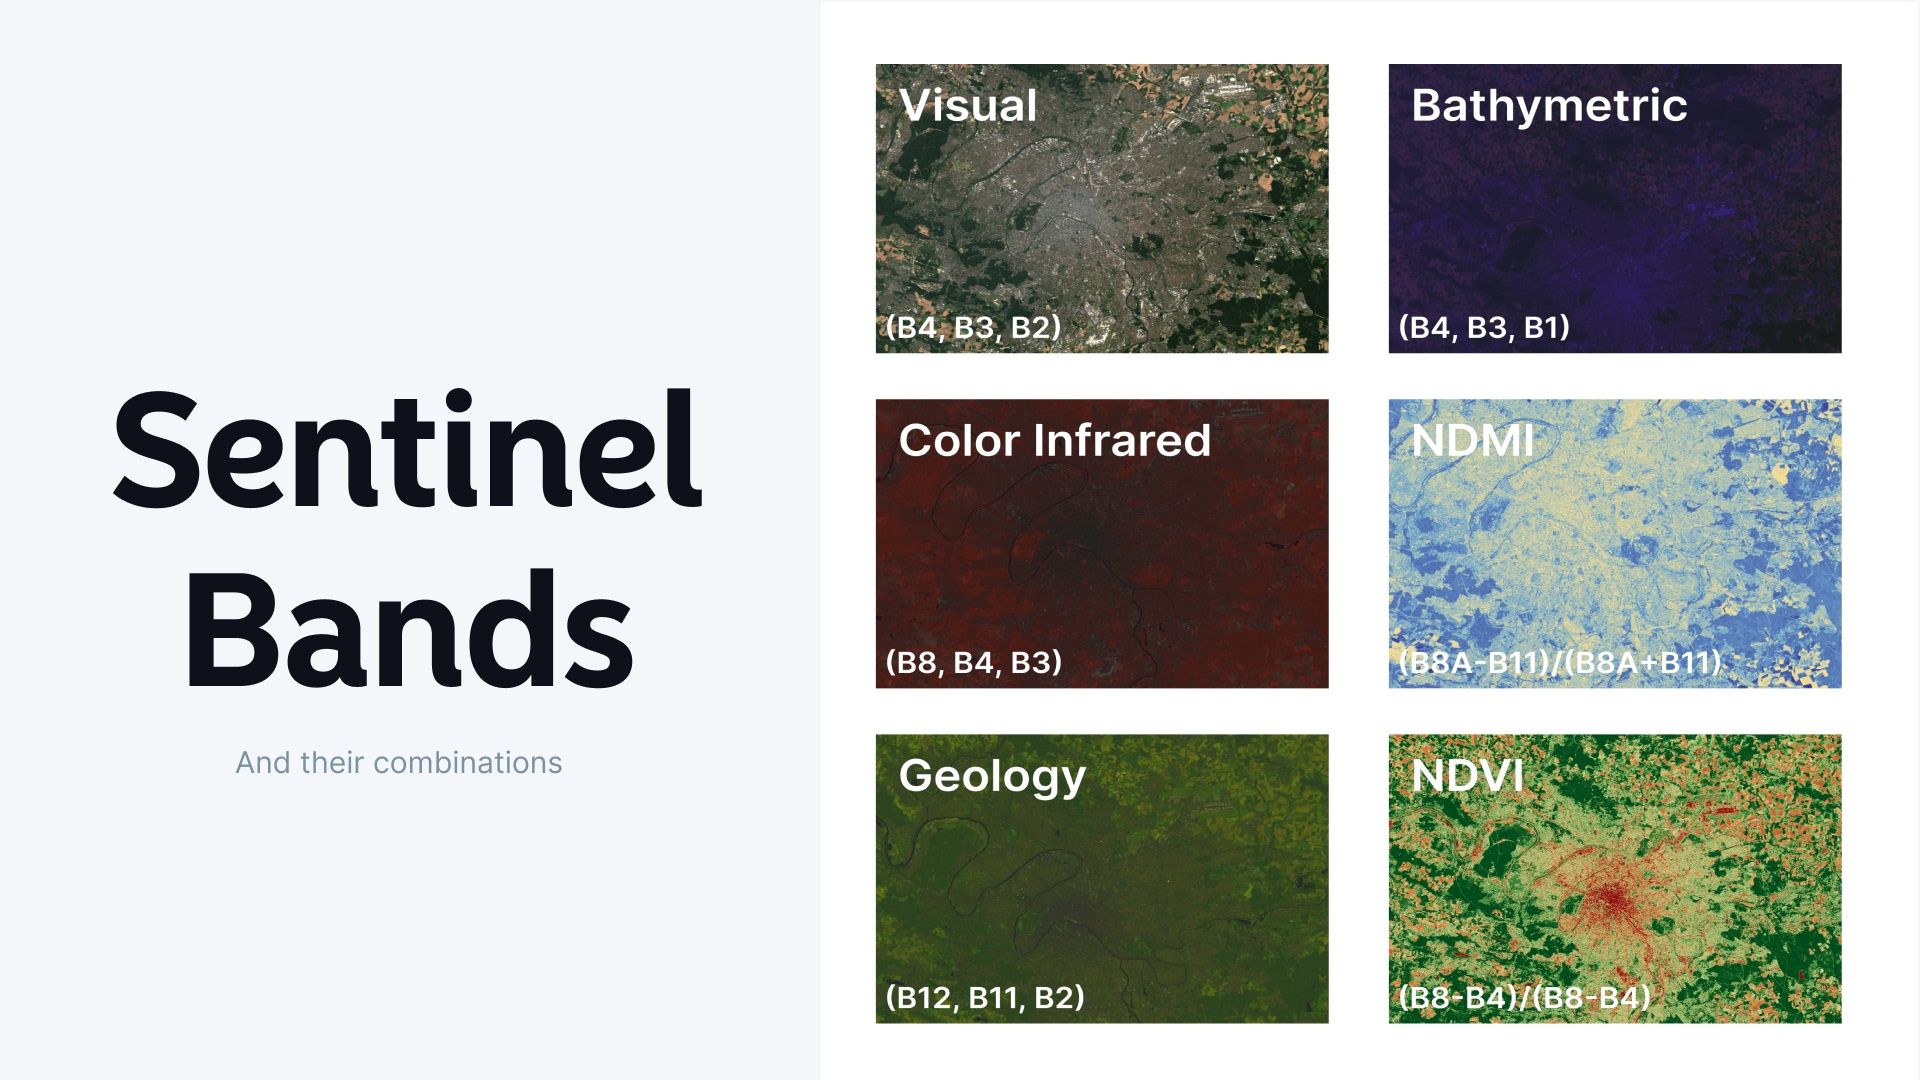
In the world of Geographic Information Systems (GIS), Sentinel-2 satellites are like the Swiss Army knives of Earth observation. These incredible tools carry a Multi-Spectral Instrument (MSI) that captures light in 13 different spectral bands. Each band serves a unique purpose, allowing us to see our planet in ways the human eye can't. Let's dive into the fascinating world of Sentinel bands and discover how combining them can reveal hidden insights about our land, water, and atmosphere.
The Sentinel-2 Band Lineup
Before we explore band combinations, let's get familiar with our players. Here's a quick rundown of the Sentinel-2 bands:
| Band | Name | Central Wavelength (µm) | Resolution (m) |
|---|---|---|---|
| B1 | Coastal aerosol | 0.443 | 60 |
| B2 | Blue | 0.490 | 10 |
| B3 | Green | 0.560 | 10 |
| B4 | Red | 0.665 | 10 |
| B5 | Vegetation Red Edge | 0.705 | 20 |
| B6 | Vegetation Red Edge | 0.740 | 20 |
| B7 | Vegetation Red Edge | 0.783 | 20 |
| B8 | NIR | 0.842 | 10 |
| B8A | Narrow NIR | 0.865 | 20 |
| B9 | Water vapour | 0.945 | 60 |
| B10 | SWIR - Cirrus | 1.375 | 60 |
| B11 | SWIR | 1.610 | 20 |
| B12 | SWIR | 2.190 | 20 |
Powerful Band Combinations
Now, let's explore how these bands can work together to reveal different aspects of our environment.
NDVI: The Vegetation Detective
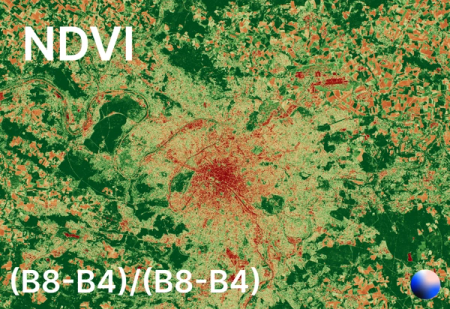
The Normalized Difference Vegetation Index (NDVI) is like a health check-up for plants. It uses the near-infrared (NIR) and red bands to measure vegetation health and density. Healthy plants reflect more NIR and absorb more red light, giving us a clear picture of vegetation cover[1].
NDMI: Moisture Meter
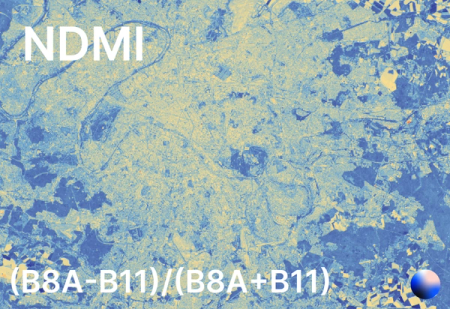
The Normalized Difference Moisture Index (NDMI) is all about water content. It combines NIR and short-wave infrared (SWIR) bands to detect moisture levels in vegetation and soil. This combo is particularly useful for monitoring drought conditions and fire risk[1].
Visual Bands: The World as We See It
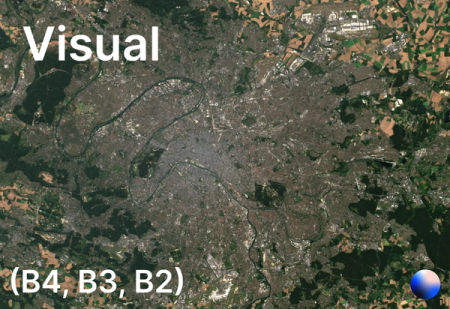
Combining the red, green, and blue bands (B4, B3, B2) gives us a natural color image that looks just like what we see with our eyes. It's perfect for creating easy-to-understand maps and identifying visible land features[4].
Color Infrared: Vegetation Highlighter
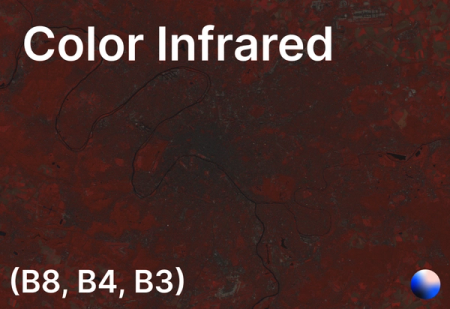
By swapping the red band for NIR (B8, B4, B3), we get a color infrared image. This combination makes healthy vegetation pop out in bright red, making it easier to assess plant health and distinguish between different types of vegetation[4].
Geology: Rockin' the Spectrum
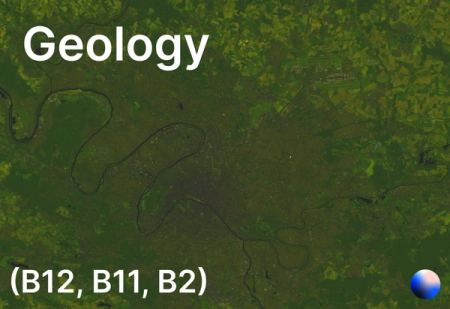
The geology band combination (B12, B11, B2) is a geologist's best friend. It uses two SWIR bands and the blue band to highlight different rock types, faults, and geological formations. This combo can reveal hidden structures and help in mineral exploration[4].
Agriculture: Crop Health Monitor
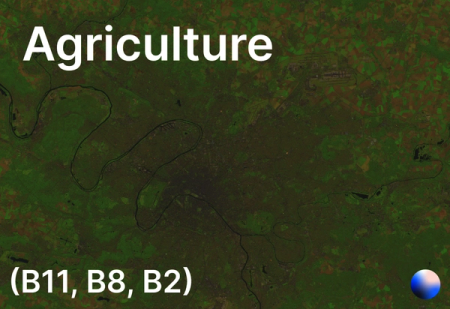
Farmers and agronomists love the agriculture band combination (B11, B8, B2). It uses SWIR, NIR, and blue bands to assess crop health and soil moisture. Dense, healthy vegetation appears dark green, making it easy to spot areas that need attention[4].
Bathymetric: Diving into Water Depths
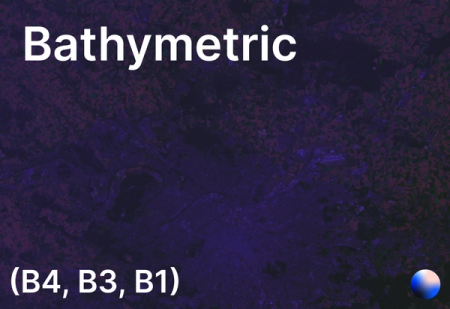
The bathymetric combination (B4, B3, B1) is perfect for coastal studies. It uses red, green, and the coastal aerosol band to estimate water depth and detect suspended sediments. This combo is invaluable for monitoring coastal erosion and mapping shallow water habitats[4].
Short-Wave Infrared: Seeing Through Haze
The SWIR bands (B11 and B12) are like x-ray vision for Earth observation. They can penetrate atmospheric haze and thin clouds, making them excellent for monitoring forest fires, soil moisture, and even distinguishing between snow and clouds[2].
Putting It All Together
By cleverly combining these bands, we can extract a wealth of information about our planet. From tracking urban growth to monitoring deforestation, assessing crop health, or mapping flood extent, Sentinel-2 band combinations provide powerful tools for understanding and managing our environment.
Remember, the key to unlocking these insights is knowing which bands to use and how to interpret the results. With practice and the right tools, you can become a master at reading the hidden stories in satellite imagery.
Ready to explore the world through a new lens? Dive into Atlas and start experimenting with Sentinel-2 band combinations today. You'll be amazed at what you can discover about our planet from space!
Citations:
[2] https://custom-scripts.sentinel-hub.com/custom-scripts/sentinel-2/bands/
[3] https://hatarilabs.com/ih-en/how-many-spectral-bands-have-the-sentinel-2-images

