A tree isn’t just a point on a map. It has inspections. A field has soil samples. A reservoir has water flowing in and out.
These things are connected.
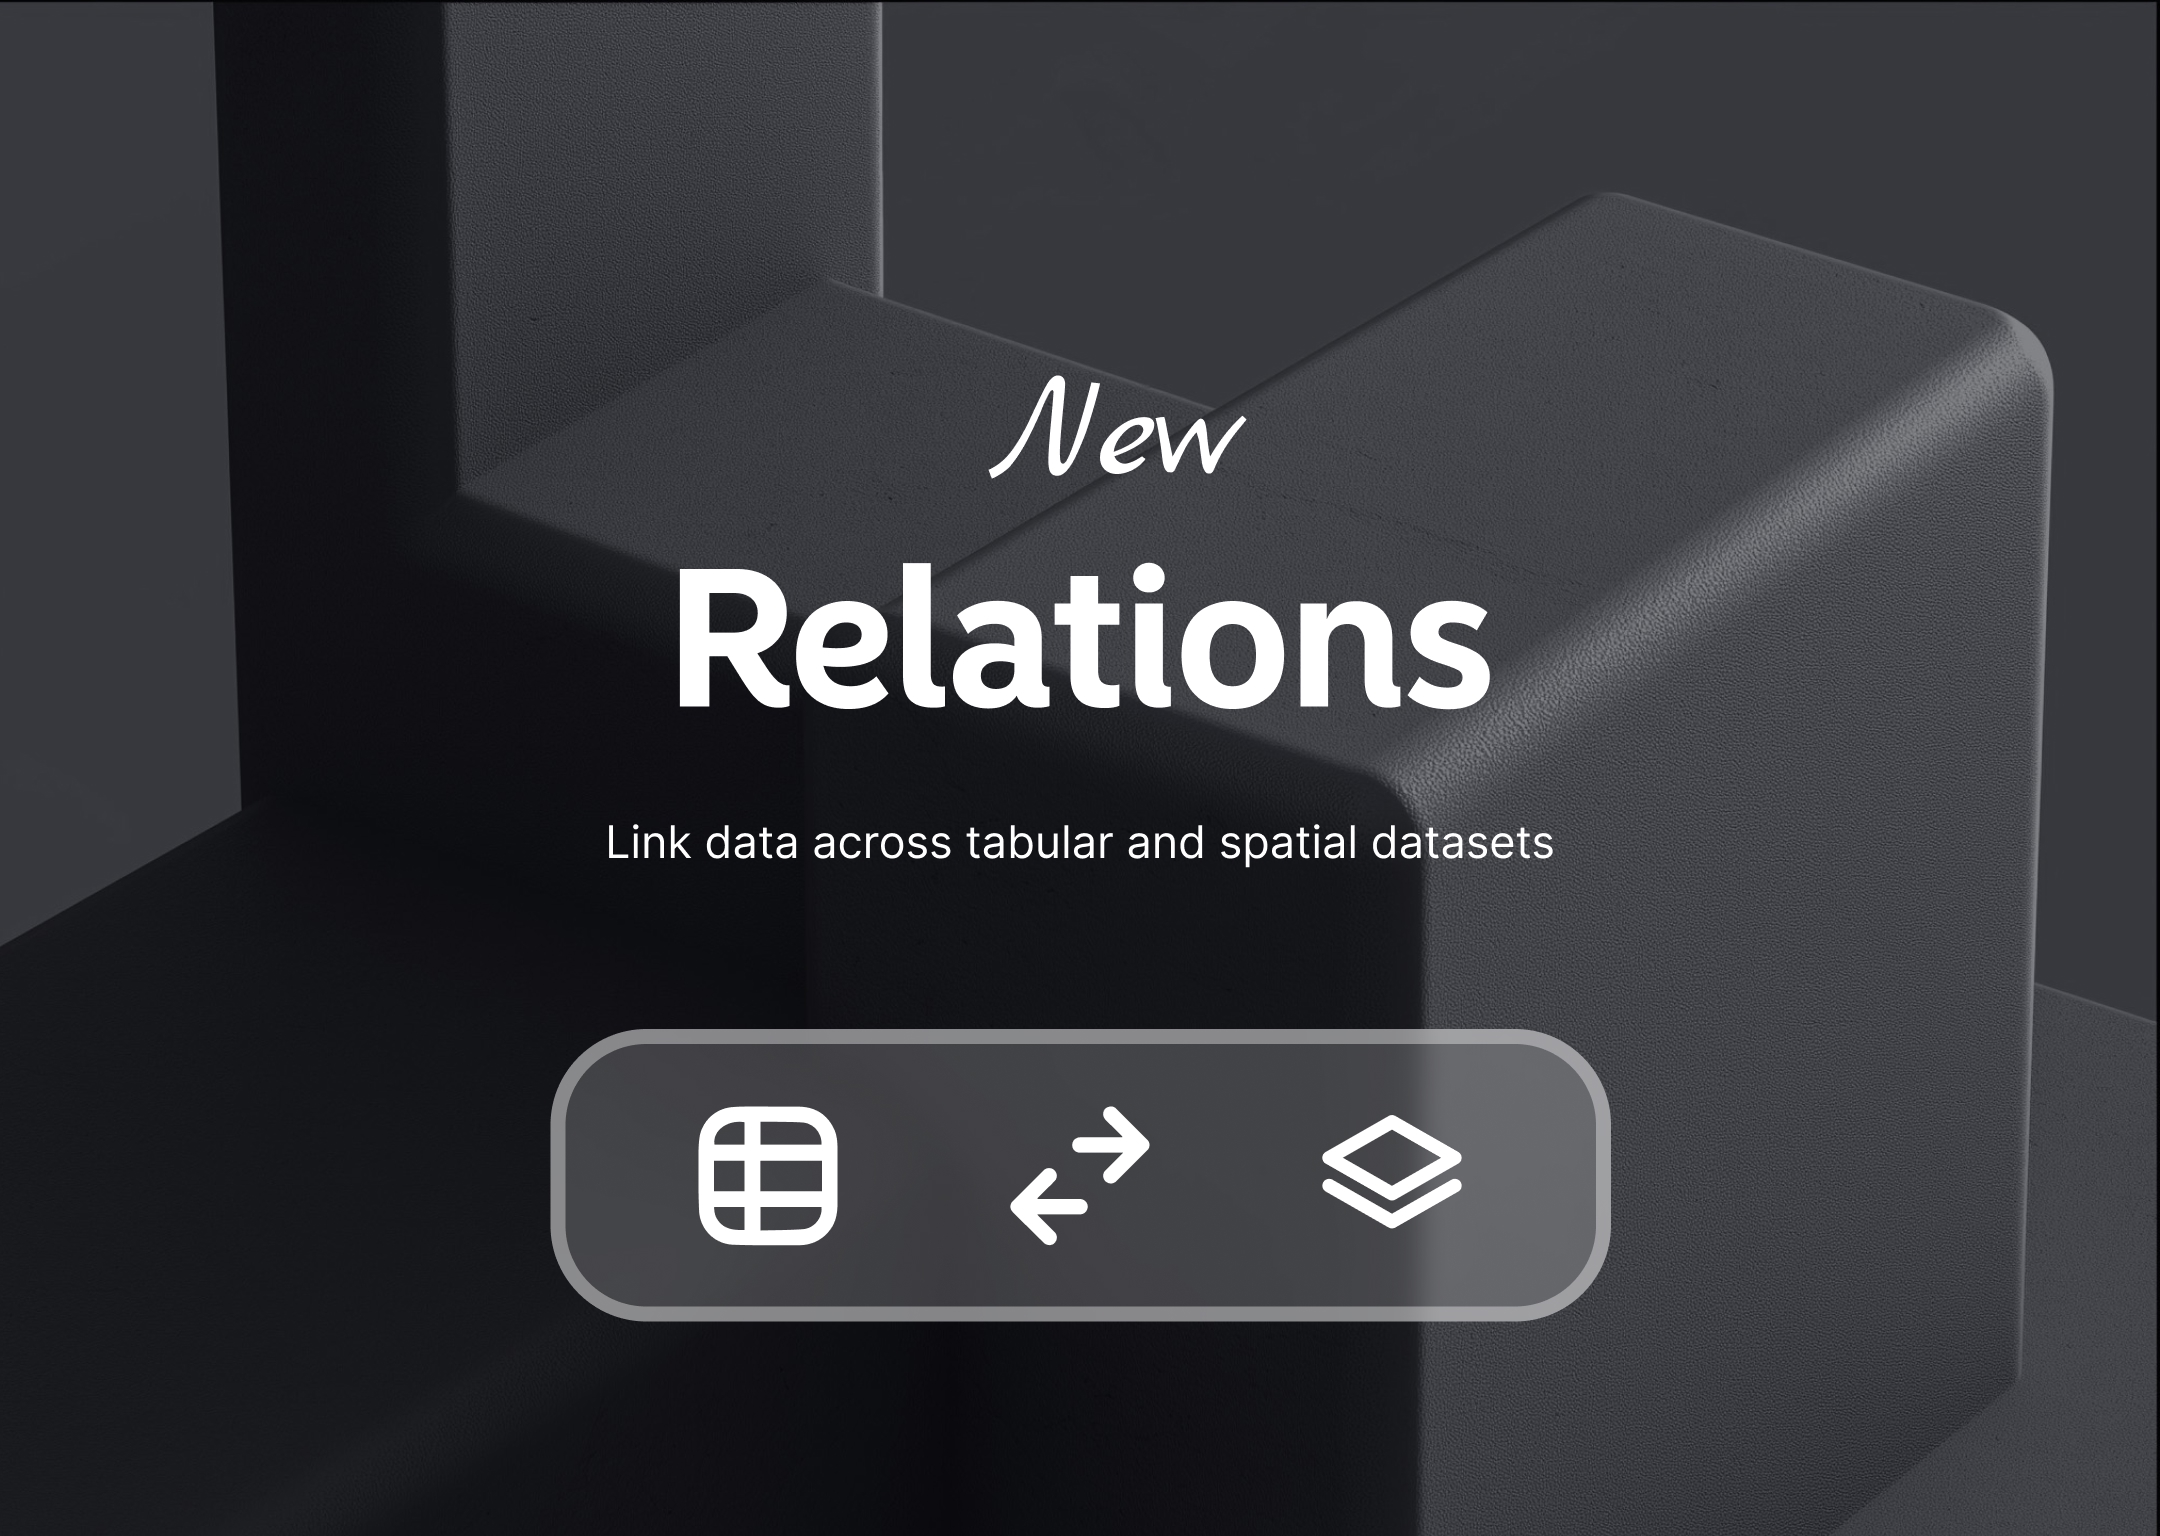
And now, in Atlas, your data can be too.
So... what’s Relations?
Relations is a new feature that lets you link records across datasets.
It means you can say things like:
- “These 5 inspections belong to this tree.”
- “These soil measurements are for that field.”
- “This inflow and outflow data is tied to that reservoir.”
You’re not just looking at points anymore. You’re building real relationships.
Read more about the technical aspects around relations here: Relations in GIS
Why we built this
People kept asking for it.
They had two datasets. Like fields and samples. Or reservoirs and flow meters.
And they wanted to connect them.
Some folks tried workarounds — like copying IDs between tables or exporting everything to Excel just to run a basic average.
It was messy.
We knew there had to be a better way. So we built it.
What you can do with Relations
Once things are connected, the possibilities open up.
- Show related records in a panel or popup
- Calculate rollups — like average values, counts, or last updates
- Visualize connections with lines on the map
- Filter and sort based on related data
You’re not just managing data — you’re understanding it.
A few real examples
Tree inspections
Every tree has a bunch of inspections.
Now you can:
- Link them
- Track condition changes over time
- See “last inspected” right on the tree layer
Farmland and soil samples
One field. Dozens of samples.
Relations let you:
- Group samples by field
- Show the average pH or moisture per plot
- Track how things change through the seasons
Water systems
This one’s a big one.
Reservoirs have inflows and outflows. They need balance.
Now you can:
- Connect flow meters to reservoirs
- Calculate net water gain/loss
- Spot issues like leaks or overflows — fast
Under the hood (but still simple)
We went deep on this.
We tested a bunch of ways to build it — from simple ID links to full join tables.
In the end, we built a hybrid system:
- There’s a dedicated table that tracks the connections
- We also pre-calculate some values for speed
- A background worker handles updates behind the scenes
You won’t see any of that — but you’ll feel it.
Things stay fast. Your map stays smooth. Your data stays up to date.
Already have data? We’ve got you.
If you're coming from another system (or just a big spreadsheet), you can use auto-matching.
Just tell Atlas what columns to match — like “Tree ID” or “Reservoir Name” — and we’ll do the linking for you.
No manual setup. No rework.
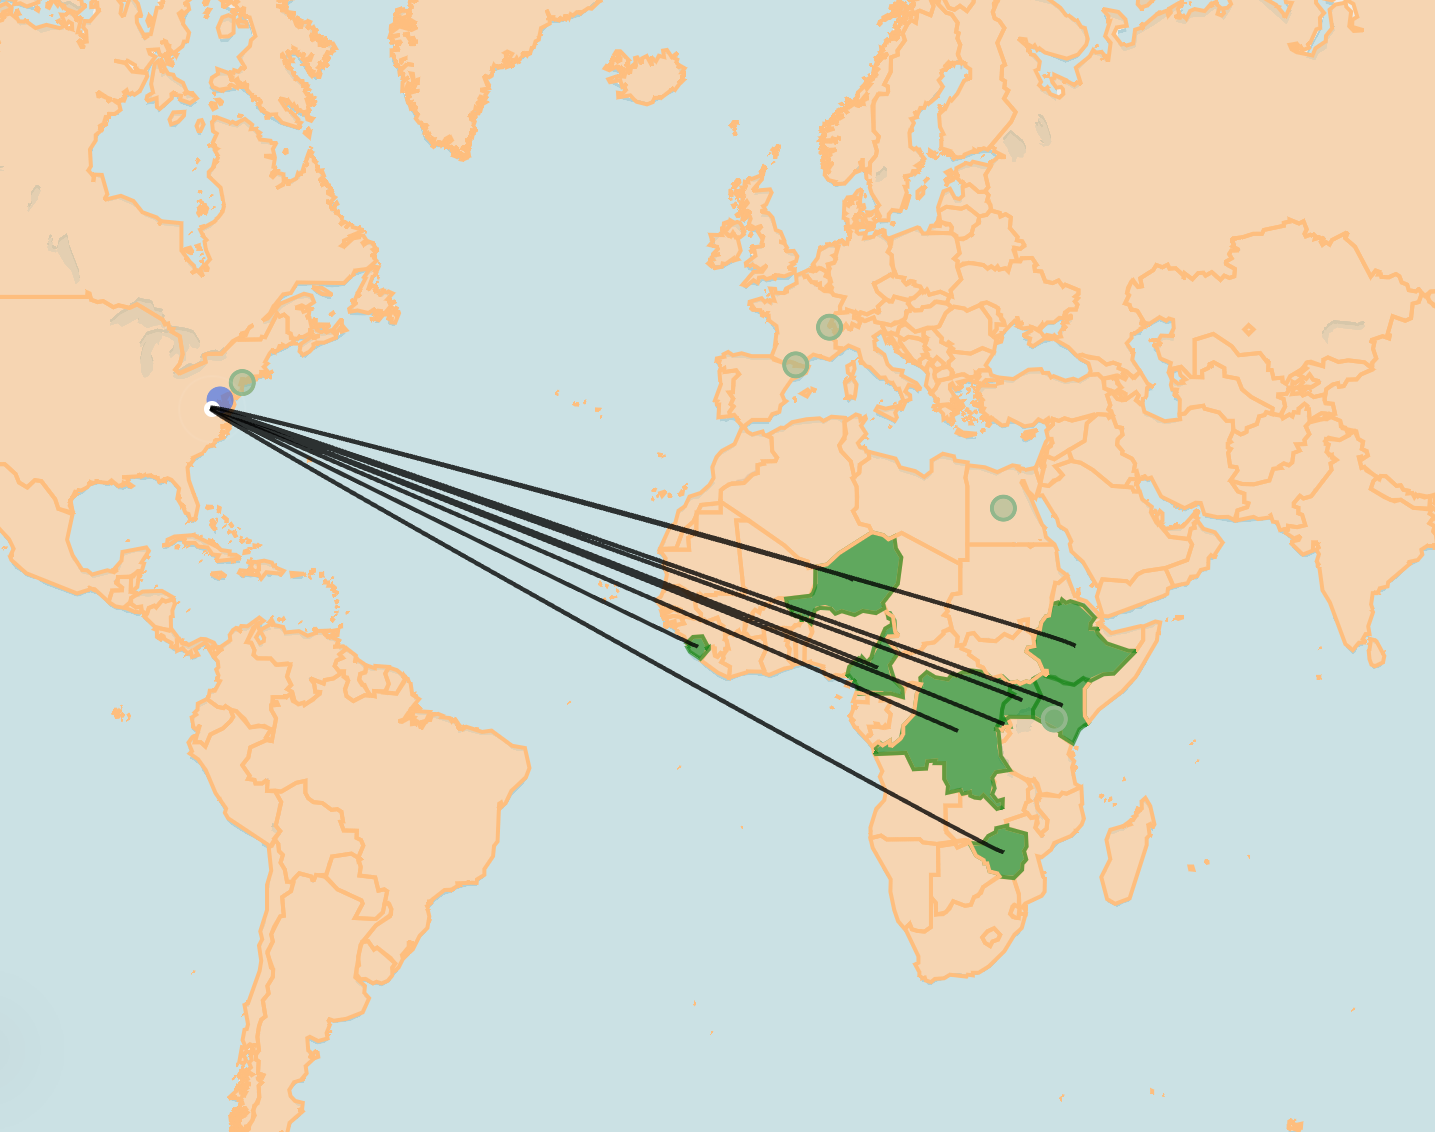
Visualizing relations
Here’s the fun part.
When two things are connected, you’ll see it on the map.
We draw curved lines between features — with different colors and styles.
It’s not just pretty — it’s useful.
You can:
- See where inspections belong
- Trace flow paths between systems
- Quickly spot coverage gaps or duplicates
It makes your data feel alive.
Try it out
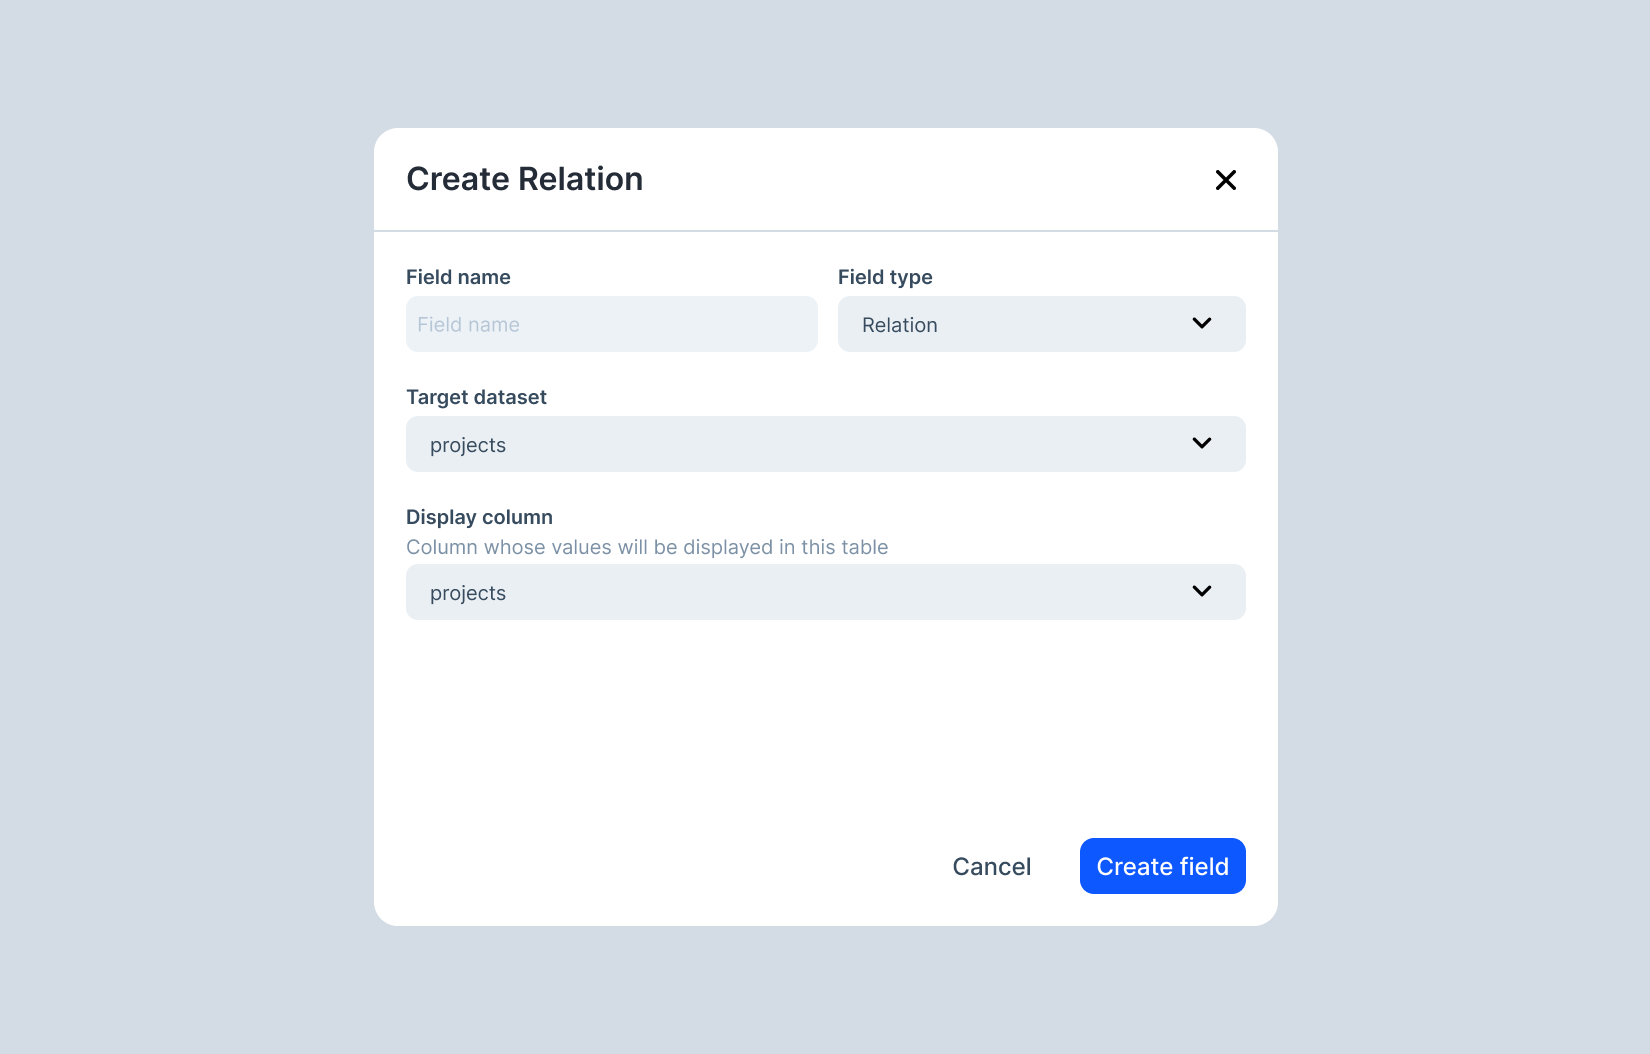
Here’s how to start:
- Open your Atlas project
- Open the Data table of a dataset
- Create a new field and choose Relation type
- Pick which fields to link
- (Optional) run auto-matching and create lookup fields
- Start exploring your connected data
This is one of our biggest launches yet.
It’s a small feature with a huge impact.
And it’s live for everyone, right now.
We can’t wait to see what you connect.