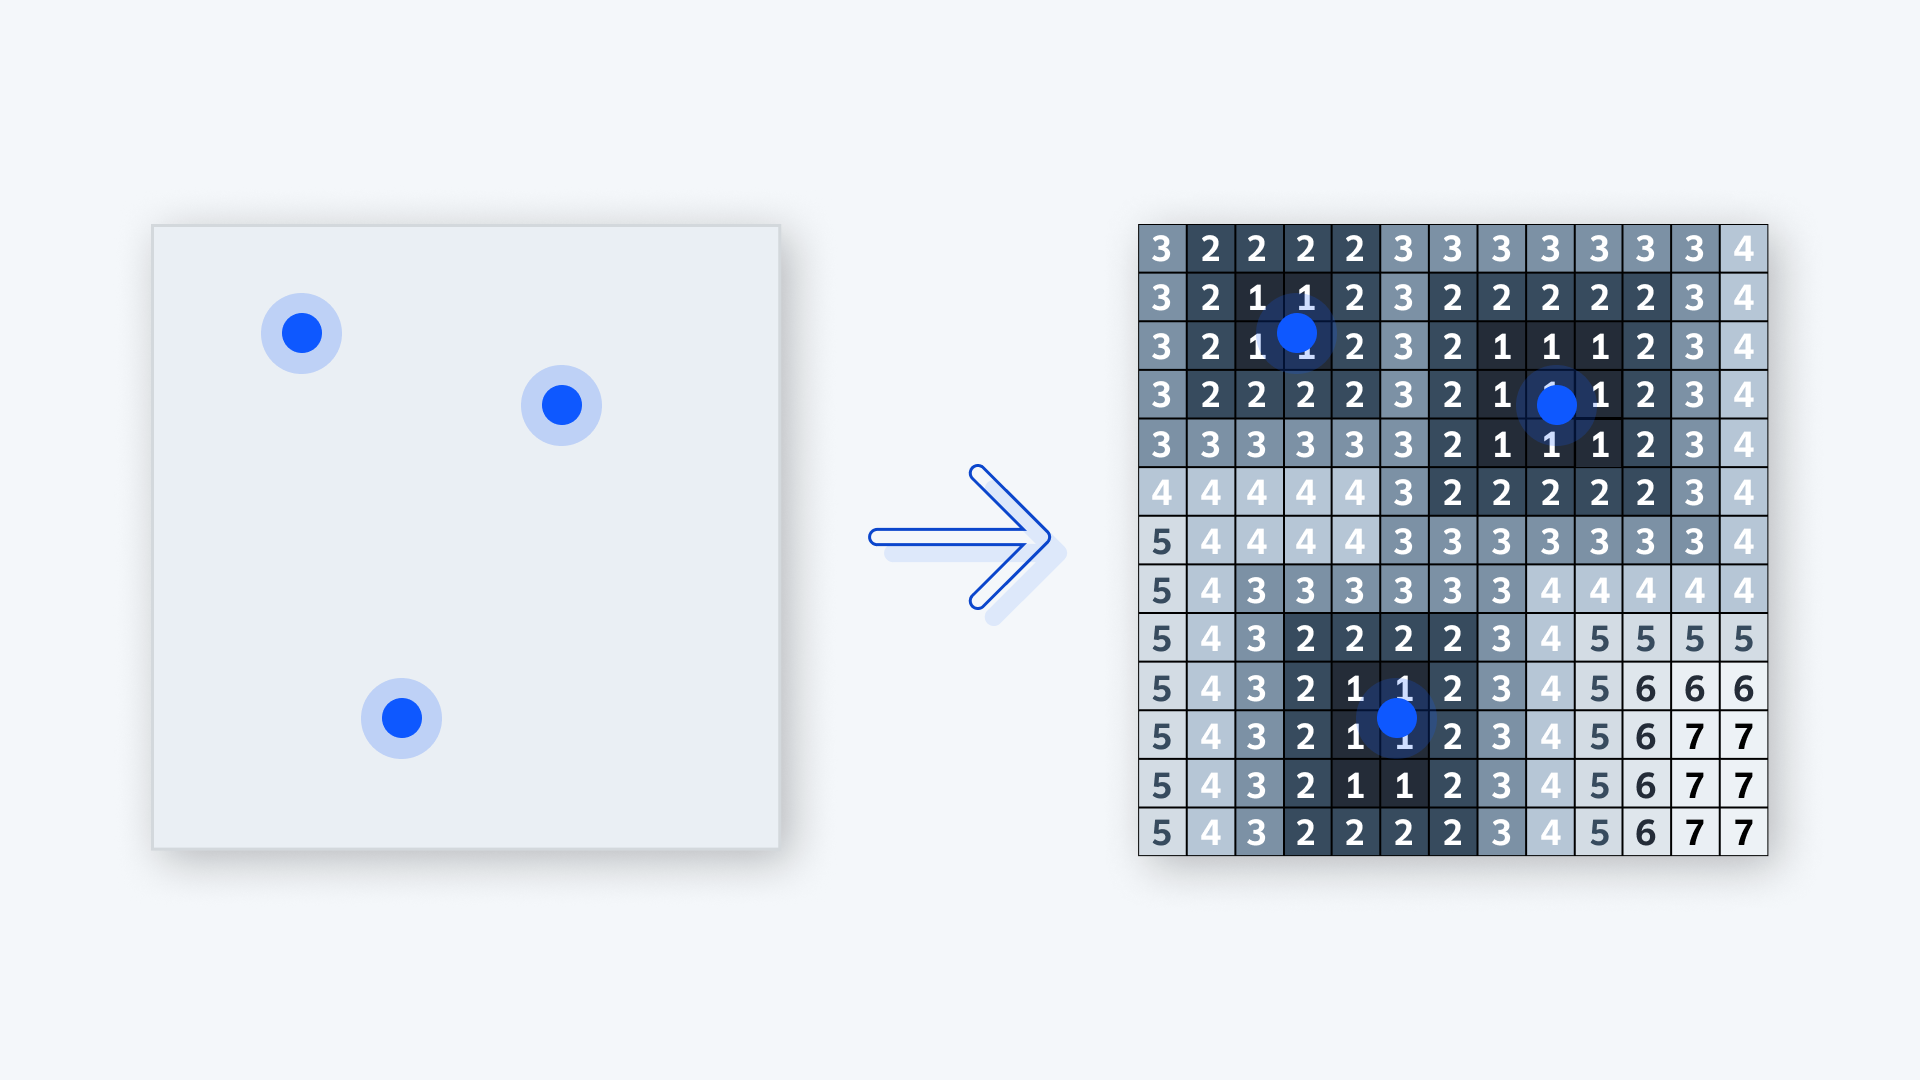
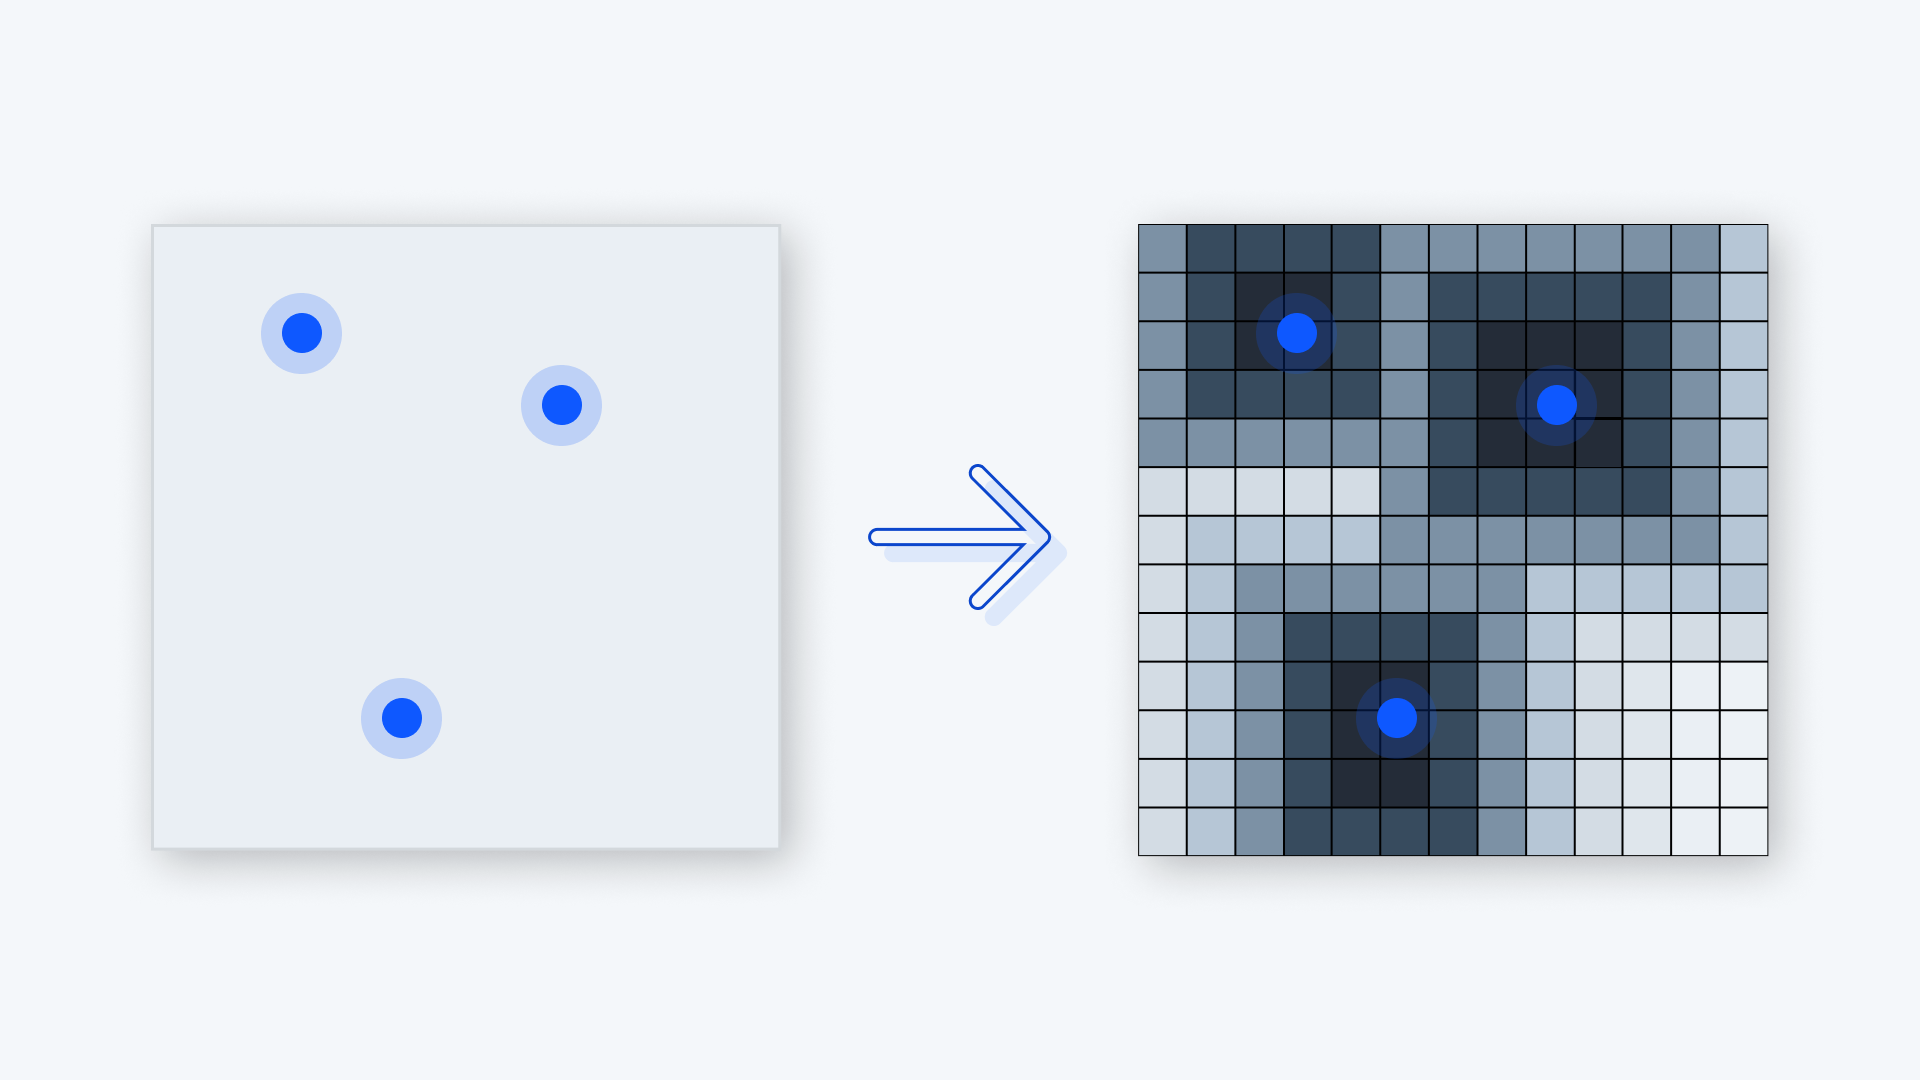
Creating a distance raster is a useful GIS operation to calculate and visualize distances from points, lines, or polygons. Ideal for urban planning, environmental analysis, and transportation logistics.
Let’s walk through how to create a distance raster step-by-step using Atlas.
What is a Distance Raster?
A distance raster represents the distance from a feature (such as a point or line) to each cell in a raster dataset. Each cell in the raster holds a value corresponding to the distance from the nearest feature.

For example:
- In urban planning, distance rasters can model accessibility, showing how far neighborhoods are from schools or public transit.
- In environmental studies, they can help assess the impact zones around natural reserves or rivers.
Atlas makes it simple to generate these outputs directly in your browser.
Steps to Create a Distance Raster
1. Prepare Your Data
Start with the data you want to analyze. These might be:
- Points: Locations of hospitals, schools, or bus stops.
- Lines: Roads, rivers, or pipelines.
- Polygons: Parks, lakes, or city boundaries.
Ensure your data is in a compatible format like CSV, GeoJSON, or Shapefile. Upload the dataset to Atlas by navigating to the "Add Data" section in the platform.
If you don't have a dataset, try to query data from OpenStreetMap directly in Atlas.
2. Select the Input Layer
Once your data is uploaded:
- Choose the layer representing the features from which you want to calculate distances.
- For example, if you're analyzing accessibility, select a layer of schools or healthcare facilities.
3. Open the Distance Raster Tool
Atlas includes tools for spatial analysis. To create a distance raster:
- Navigate to the Raster Operations section in Atlas.
- Select the Distance Raster tool. This tool will calculate distances from each feature in your layer to all areas in the raster grid.
4. Configure the Analysis
In the tool settings, configure:
- Resolution: Choose the grid size of your raster. Smaller grid sizes give higher detail but require more processing power.
- Maximum distance to calculate Define the maximum distance for the analysis. The default is 1000 meters.
5. Run the Analysis
Click "Run" to generate the distance raster. Atlas will process the data and produce a new raster layer.
Check out the video below for a step-by-step tutorial using generate random points inside polygon.
Visualizing the Distance Raster
After creating the raster:
- Style the Layer: Use Atlas’s styling tools to apply a color gradient, where colors represent increasing distances. For example, darker shades might indicate shorter distances, while lighter shades show greater distances.
- Analyze Patterns: Look for trends, such as areas underserved by infrastructure or regions with excellent accessibility.
Practical Applications
Urban Planning
Urban planners can identify areas that lack proximity to schools, hospitals, or public transportation. This data can inform decisions about new developments or infrastructure improvements.
Environmental Conservation
Conservationists can model the influence zones around natural features like rivers or wetlands. Distance rasters help assess areas at risk of deforestation or encroachment.
Logistics and Delivery
Companies can optimize delivery routes by analyzing distance rasters around distribution centers or key transport hubs.
Export and Share Your Results
Once the analysis is complete:
- Export the Raster: Download it in formats like GeoTIFF for use in presentations or further analysis.
- Share the Map: Use Atlas’s sharing options to create a public link or embed your interactive map on a website.
Tips for Effective Distance Raster Creation
- Focus on Data Quality: Ensure the input data is accurate and free of errors. Poor data quality can lead to incorrect distance calculations.
- Define Appropriate Extents: Avoid processing overly large areas unless necessary. Limiting the extent saves time and processing resources.
- Iterate and Experiment: Adjust the resolution and visualization settings to best highlight the patterns you're exploring.
By following these steps, creating a distance raster in Atlas becomes a straightforward task. This analysis is versatile, opening up numerous possibilities for spatial problem-solving across industries.
Final Thoughts
Distance rasters are powerful tools that bring geographic data to life. With Atlas, you can create, analyze, and share these insights without complex desktop software. The platform’s browser-based simplicity makes geospatial analysis accessible to everyone.
Try it for free in Atlas today: app.atlas.co/login.


