Creating an Accessibility Map: Step by Step Guide
In this guide, we will outline the process to build an accessibility map for Berlin's subway system using the Open Street Map (OSM) integration and the Travel Time Analysis. Creating the map should take less than 5 minutes.
Step 1: Extracting the Data from Open Street Map
To start, we will be extracting the necessary data using the Open Street Map integration.
- First, we need to move the map to the area you are interested in, for this map, I wanted to evaluate the subway network of Berlin.
- Secondly, we need to select the OSM integration. Is is accessible in the right sidepanel.

- After clicking the OSM (Open Street Map) integration, we have to find the extraction we want from the list of "tags to query", alternatively you may enter a spesific custom tag. All available OSM tags
For this case, I want to use subway=station, and I select that from the list.

Step 2: Performing the Travel Time Analysis
- To activate the analysis, I enter the "Analysis" tab. alternatively one may search for the spesific analysis in the search bar in the right side panel. The first thing I need to do is to select the dataset we have extracted from OSM.

To achieve this, I click on the "Switch to dataset", and select the OSM extraction from the dropdown menu.

- For this example, we use the 5 and 10 minutes walking times to view the network. Alternatively, you could evaluate the travel time with bike or with a car if that better suits your need.
After clicking run, the results looks like this:

Step 3: Finalizing the Visual Presentation
At the current stage, the analysis looks OK. But in order to truly capture the visual aspect of the different time travels I want to style the datalayer. To do this, I select the "Styling" from the dropdown menu in the result layer.

I want to select the "Style based on attribute" and further select the attribute that represent the time aspect.

Here you can select whichever styling suits you the best, but I want to have something indicating green for short time - and red for longer time needed. As such, I adjust the number of steps for the Quantize styling, and select a color map that goes from green to red.
Lastly, I want to alter the basemap to properly showcase the result. To do this, I click on the "Map Settings" in the bottom right part of the map.

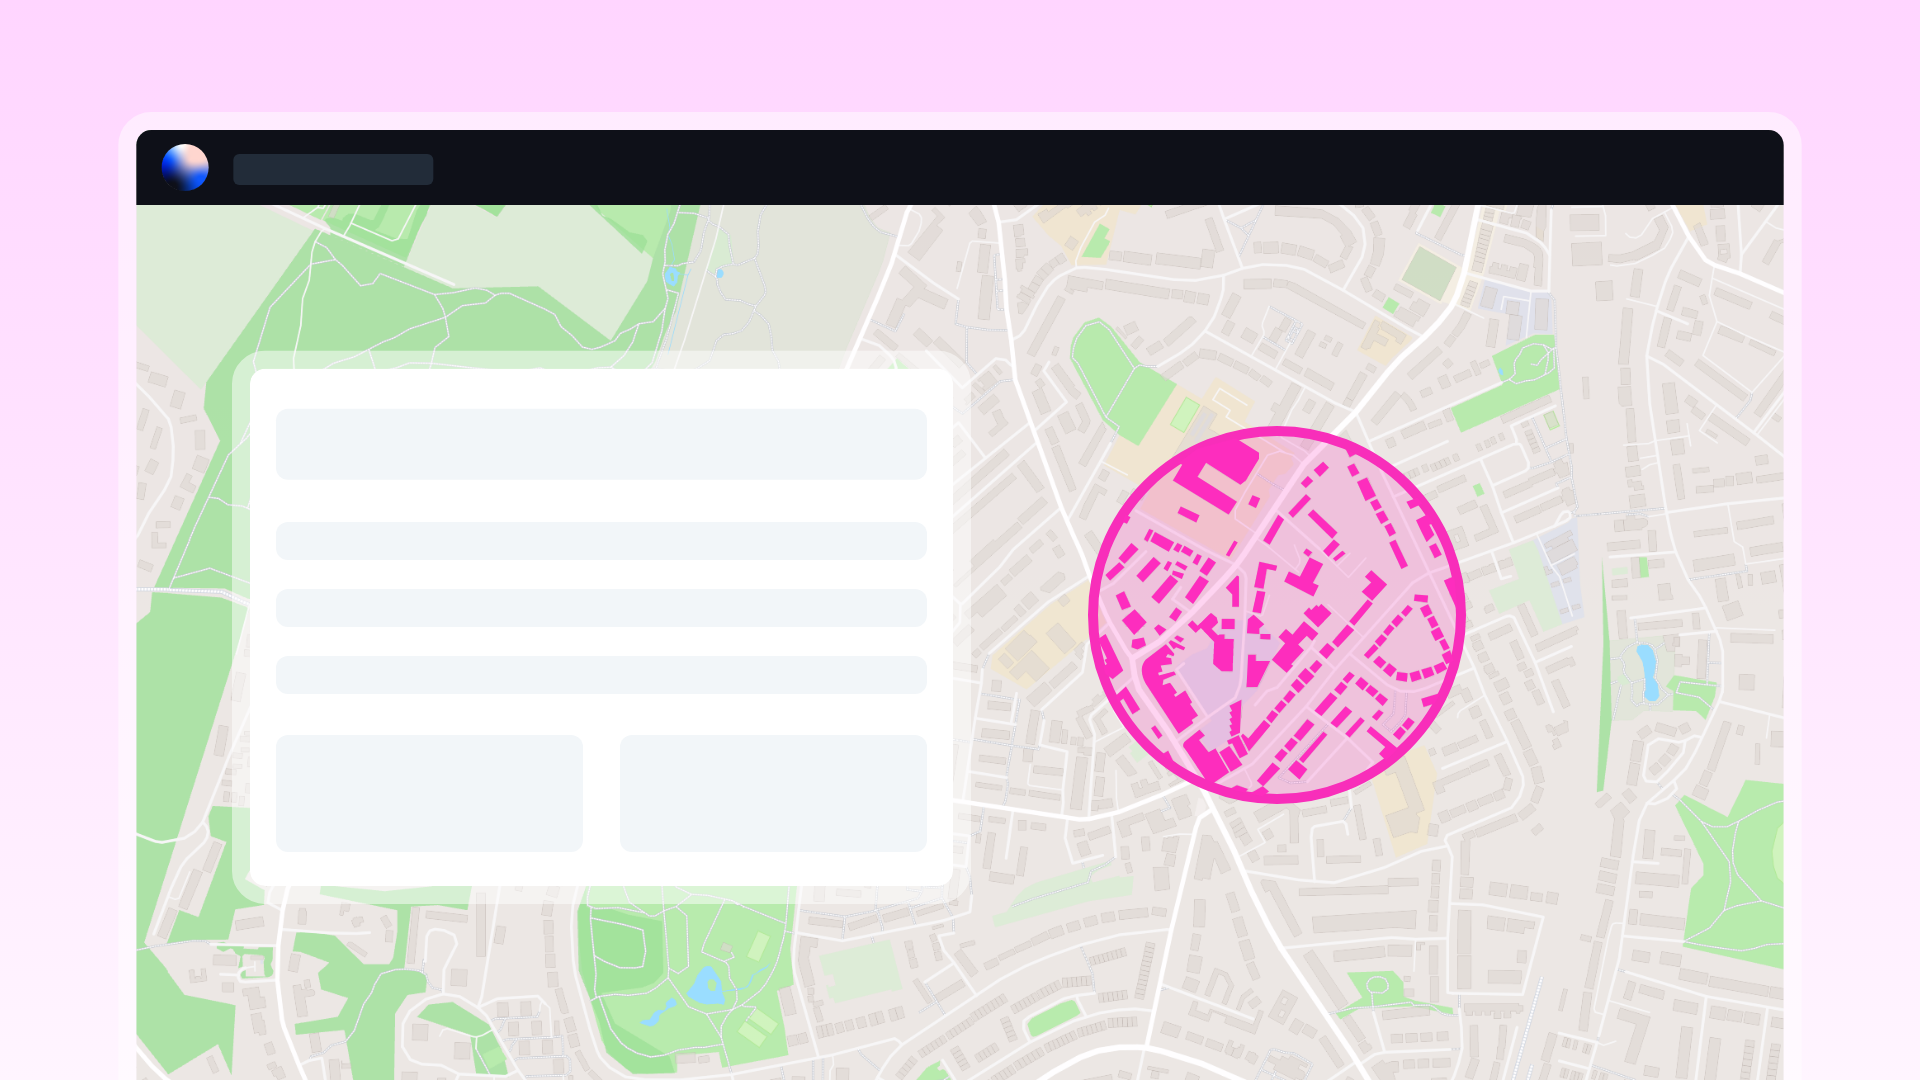
Results
The resulting map looks like this.

We hope you found this tutorial helpful, and feel free to duplicate the map or create a subway map of your own city. Your feedback and questions are greatly appreciated!