Make your maps come alive
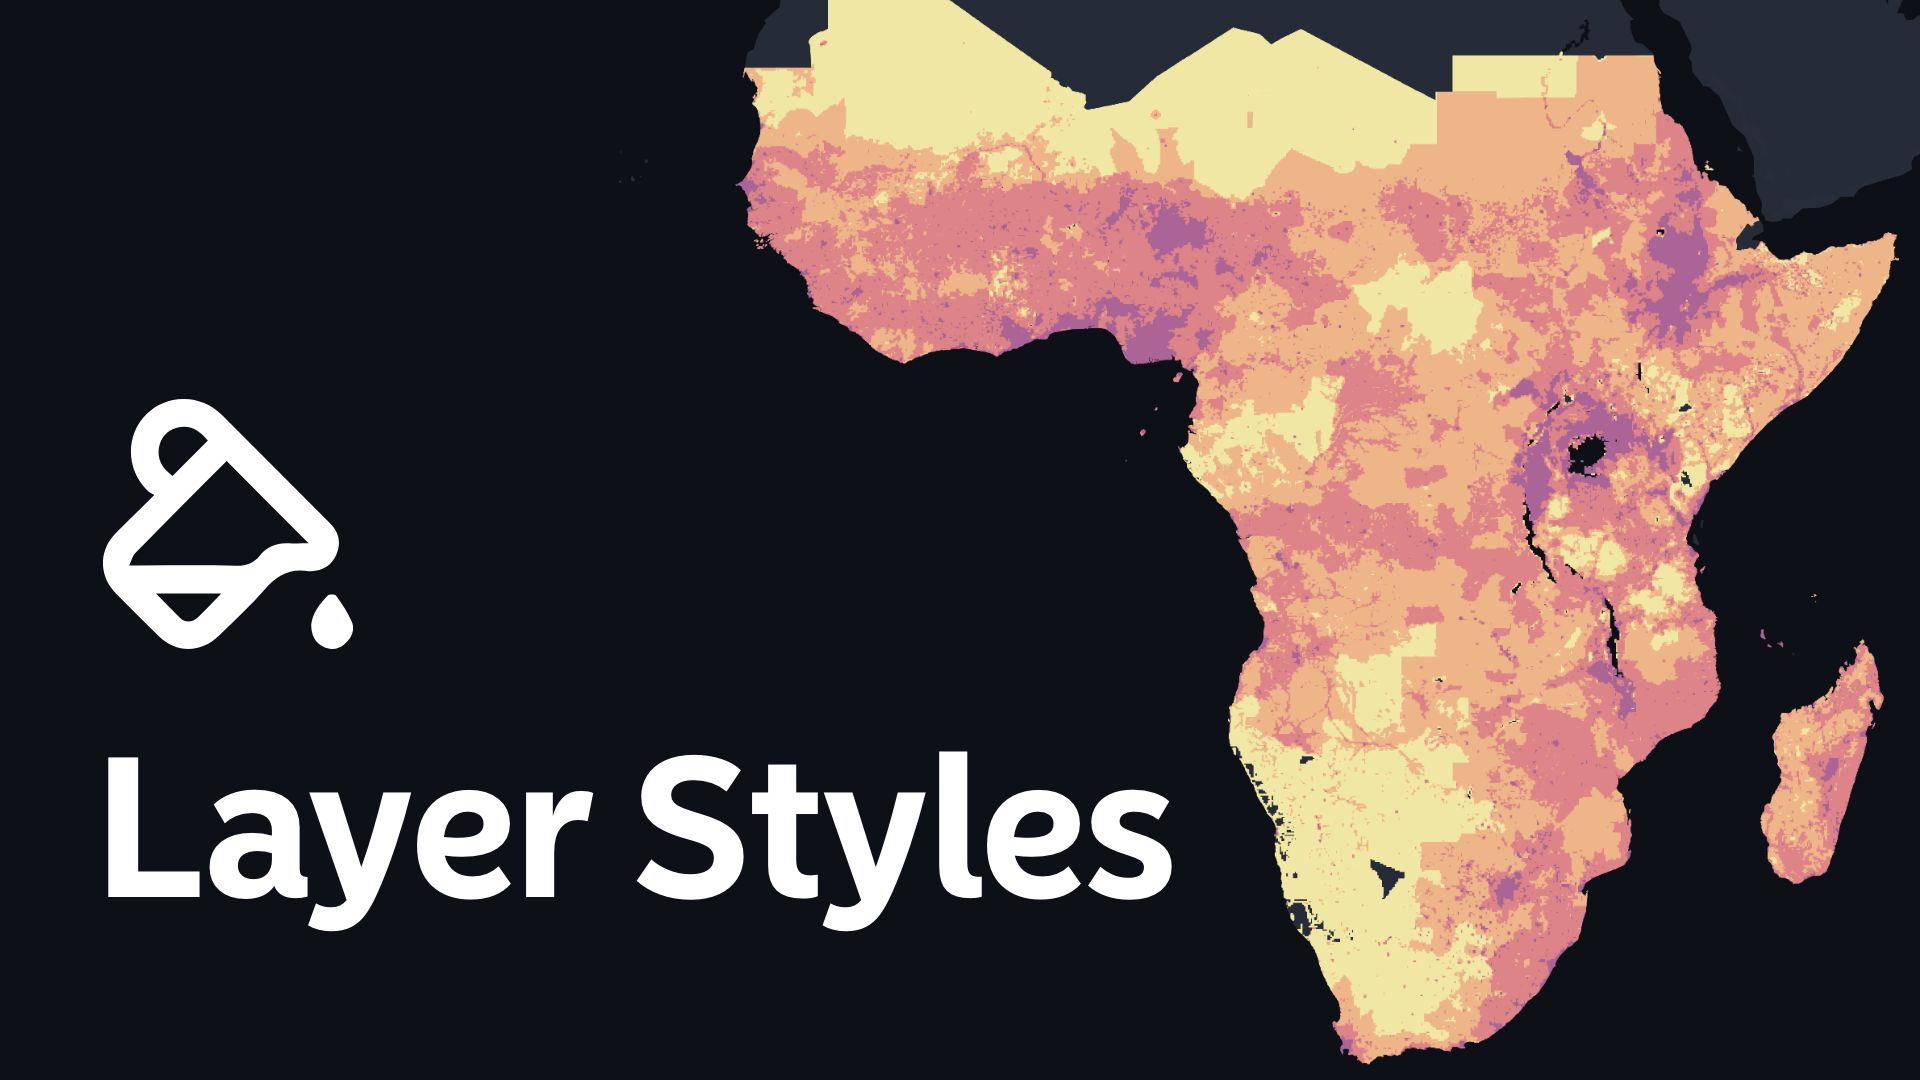
Layer styling is essential for making your maps lively and informative. It turns your data into something that's both beautiful and understandable.
It's important to note that the full extent of layer styling capabilities applies exclusively to vector data within the project or workspace.
Layer styling is divided into five different categories:
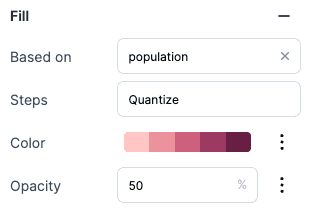
- Fill: allows you to infuse vibrant colors and patterns into the polygons of your vector data
- Outline: empowers you to define the boundaries and lines of your vector features
- Height (only applicable for polygons): for a multi-dimensional perspective, the 'Height' category enables you to add a third dimension to your data
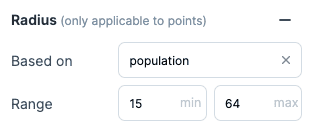
- Radius (only applicable for points): enables you to adjust the radius of point features
- Labels: offer the means to annotate your map with essential information, providing context and aiding in the interpretation of the displayed data. Customize font styles, sizes, and placements to ensure clarity and readability.
Visibility by zoom level
With this setting, you can control the zoom range where a layer should be visible. Simply set the lower zoom level where a layer would start appearing on the map; and the higher zoom level where the layer should disappear from the map.

This is specially useful for combining different types of sources: aggregated data for lower zoom levels and non-aggregated at the higher levels, administrative regions of different levels, etc.
Color Style
In Atlas, you can style the Fill Color and the Outline Color of your layers. For both of them, you can either:
- Use a Fixed color to style your layer
- Assign colors using the Color based on field, which references values from a specific data source field

Opacity
You can set the Opacity for your Fill Color and Stroke Color layer style. For that, set the number from 0 to 100 to define your desired opacity level.
Radius
Change the radius of points, or assign radius values based on a field from your dataset(s). You can change the predefined radius using the radius slider or by directly writing the radius size in the text input.
Additionally, you can access advanced options to assign radius values based on a field from your dataset(s).

Labels
Applying text labels to your data enables you to enhance the typography of your map. While adding labels is optional, they are useful for communicating details with the map viewer. Positive effects of label styling will display legible text and considerate placement of labels on the map.
Enable the Labels, select a column and then specify e.g. Font Size, Font Color, Text Anchor or Alignment.
Height
This feature allows you to assign heights to build 3D visualizations for polygons. You can activate this option by clicking the plus icon. You can change the height using the input field.
You can explore the 3D visualization by clicking on the 3D map button on the bottom right corner of the map in the Map Controls.

Need more help?
Still have questions? We're here to help! Reach out to our support team at help@atlas.co and we'll get back to you as soon as possible.

