
Satellite imagery, digital elevation models, and aerial photographs provide visualization and important geographic context to maps.
Unlike vector data, which represents geographic features as points, lines, and polygons, raster data is organized as a grid of cells, where each cell stores information about a specific location
Raster analysis in GIS involves manipulating and interpreting these grid-based datasets to derive valuable information for decision-making processes. This technique enables a wide range of spatial analyses, including terrain modeling, land cover classification, suitability mapping, and environmental monitoring.
By leveraging the pixel-based structure of raster data, you can conduct detailed assessments of spatial patterns, identify trends, and generate accurate representations of geographic phenomena.
Whether it's assessing land changes, analyzing elevation variations, or predicting environmental impacts, raster analysis contributes significantly to informed decision-making in diverse fields such as environmental science, urban planning, and natural resource management.
For this release, we’ve added 10 raster operations to power your analysis and visualization.
The added raster functions are:
- Aspect Analysis
- Contour
- Hillshade
- Slope Analysis
- Binary Classification
- Crop Raster
- Point Extraction
- Zonal Statistics
- WMS to Raster
- Raster to Vector
Raster data
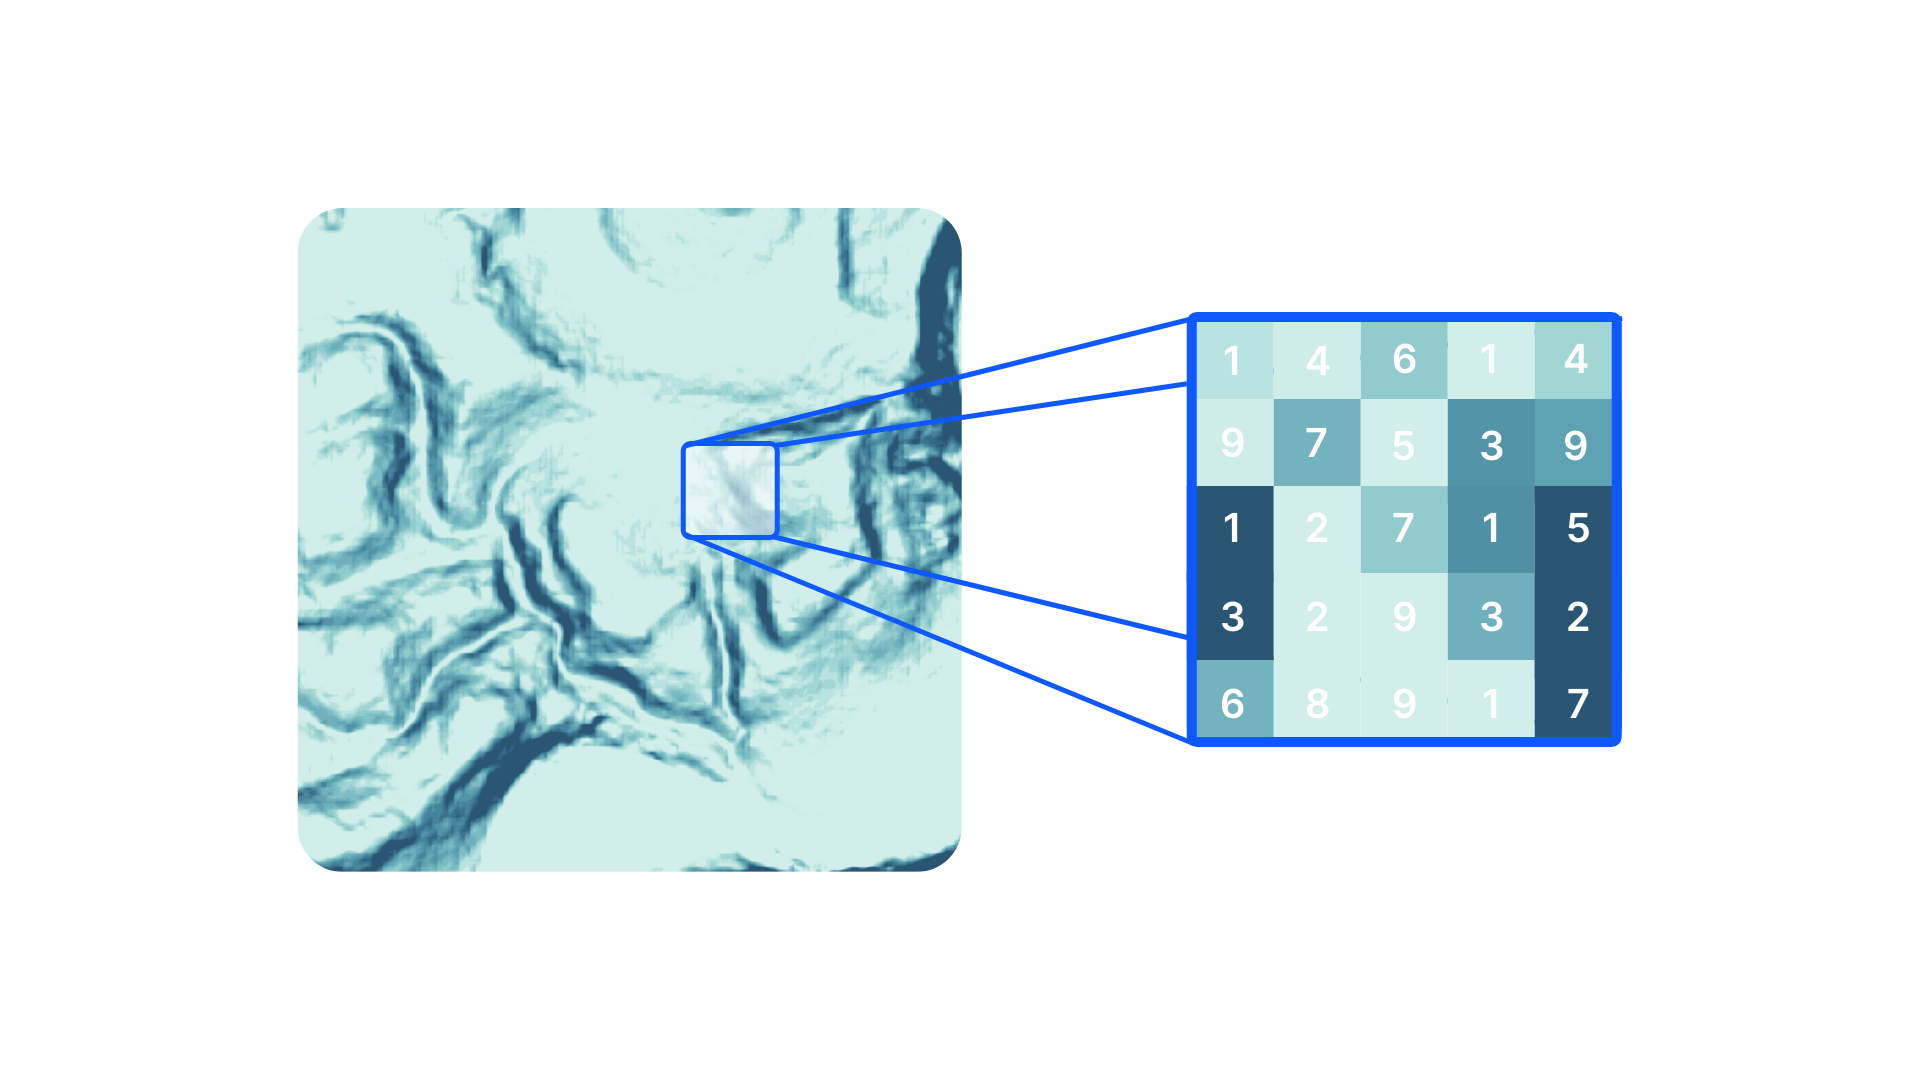
Raster data is any pixelated (or gridded) data where each pixel is associated with a specific geographical location. The value of a pixel can be continuous (e.g. elevation) or categorical (e.g. land use).
If this sounds familiar, it is because this data structure is very common: it’s how we represent any digital image.
A geospatial raster is only different from a digital photo in that it is accompanied by spatial information that connects the data to a particular location. This includes the raster’s extent and cell size, the number of rows and columns, and its coordinate reference system (or CRS).
Some examples of continuous rasters include:
- Precipitation maps.
- Maps of tree height derived from LiDAR data.
- Elevation values for a region.
Aspect Analysis
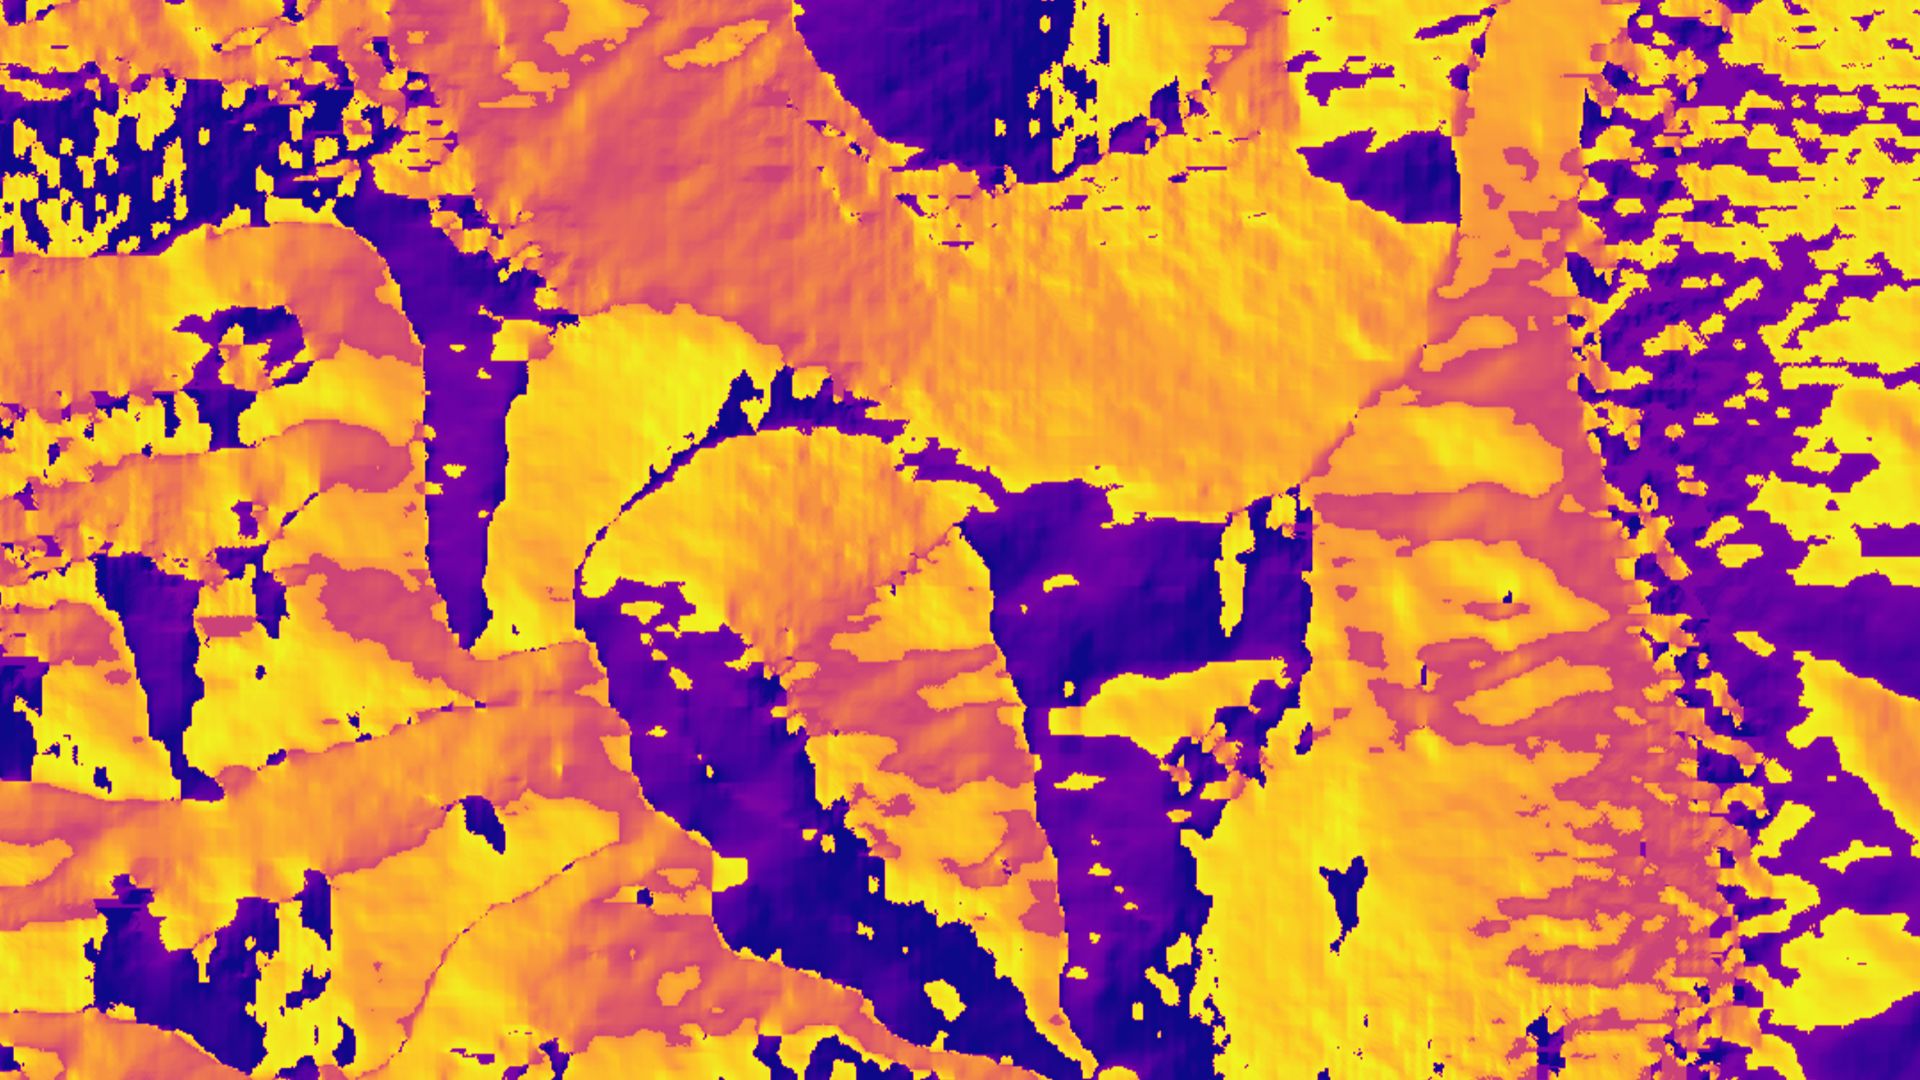
The Aspect Analysis identifies the direction the downhill slope faces. The values of each cell in the output raster indicate the compass direction the surface faces at that location. It is measured clockwise in degrees from 0 (due north) to 360 (again due north), coming full circle. Flat areas having no downslope direction are given a value of -1.
Contour
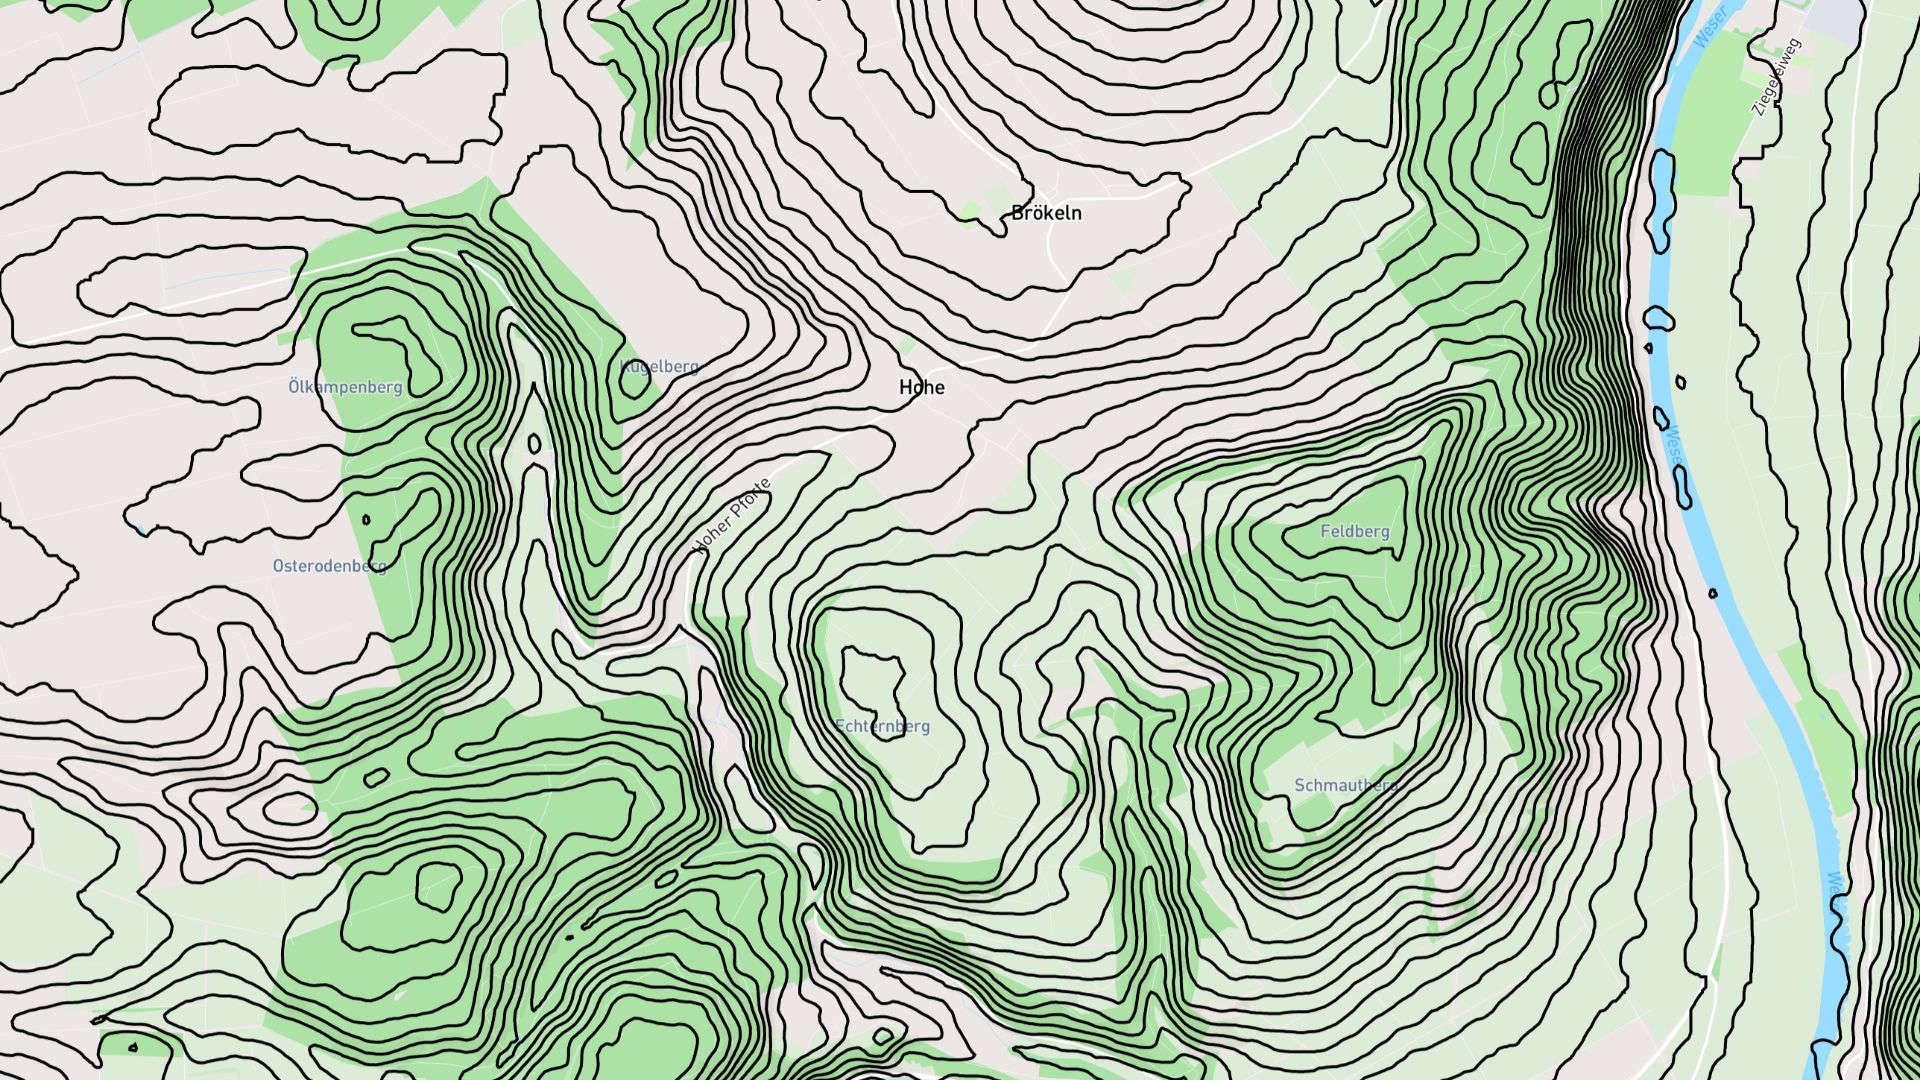
The Contour Operation assesses terrain features by analyzing elevation contours, revealing slope characteristics. It produces a dataset with lines indicating elevation values, enabling the derivation of slope information. The output aids in understanding topography, influencing factors like water flow and erosion potential. This analysis is vital for land management, environmental assessment, and infrastructure planning, providing concise insights into terrain suitability and complexity.
Hillshade
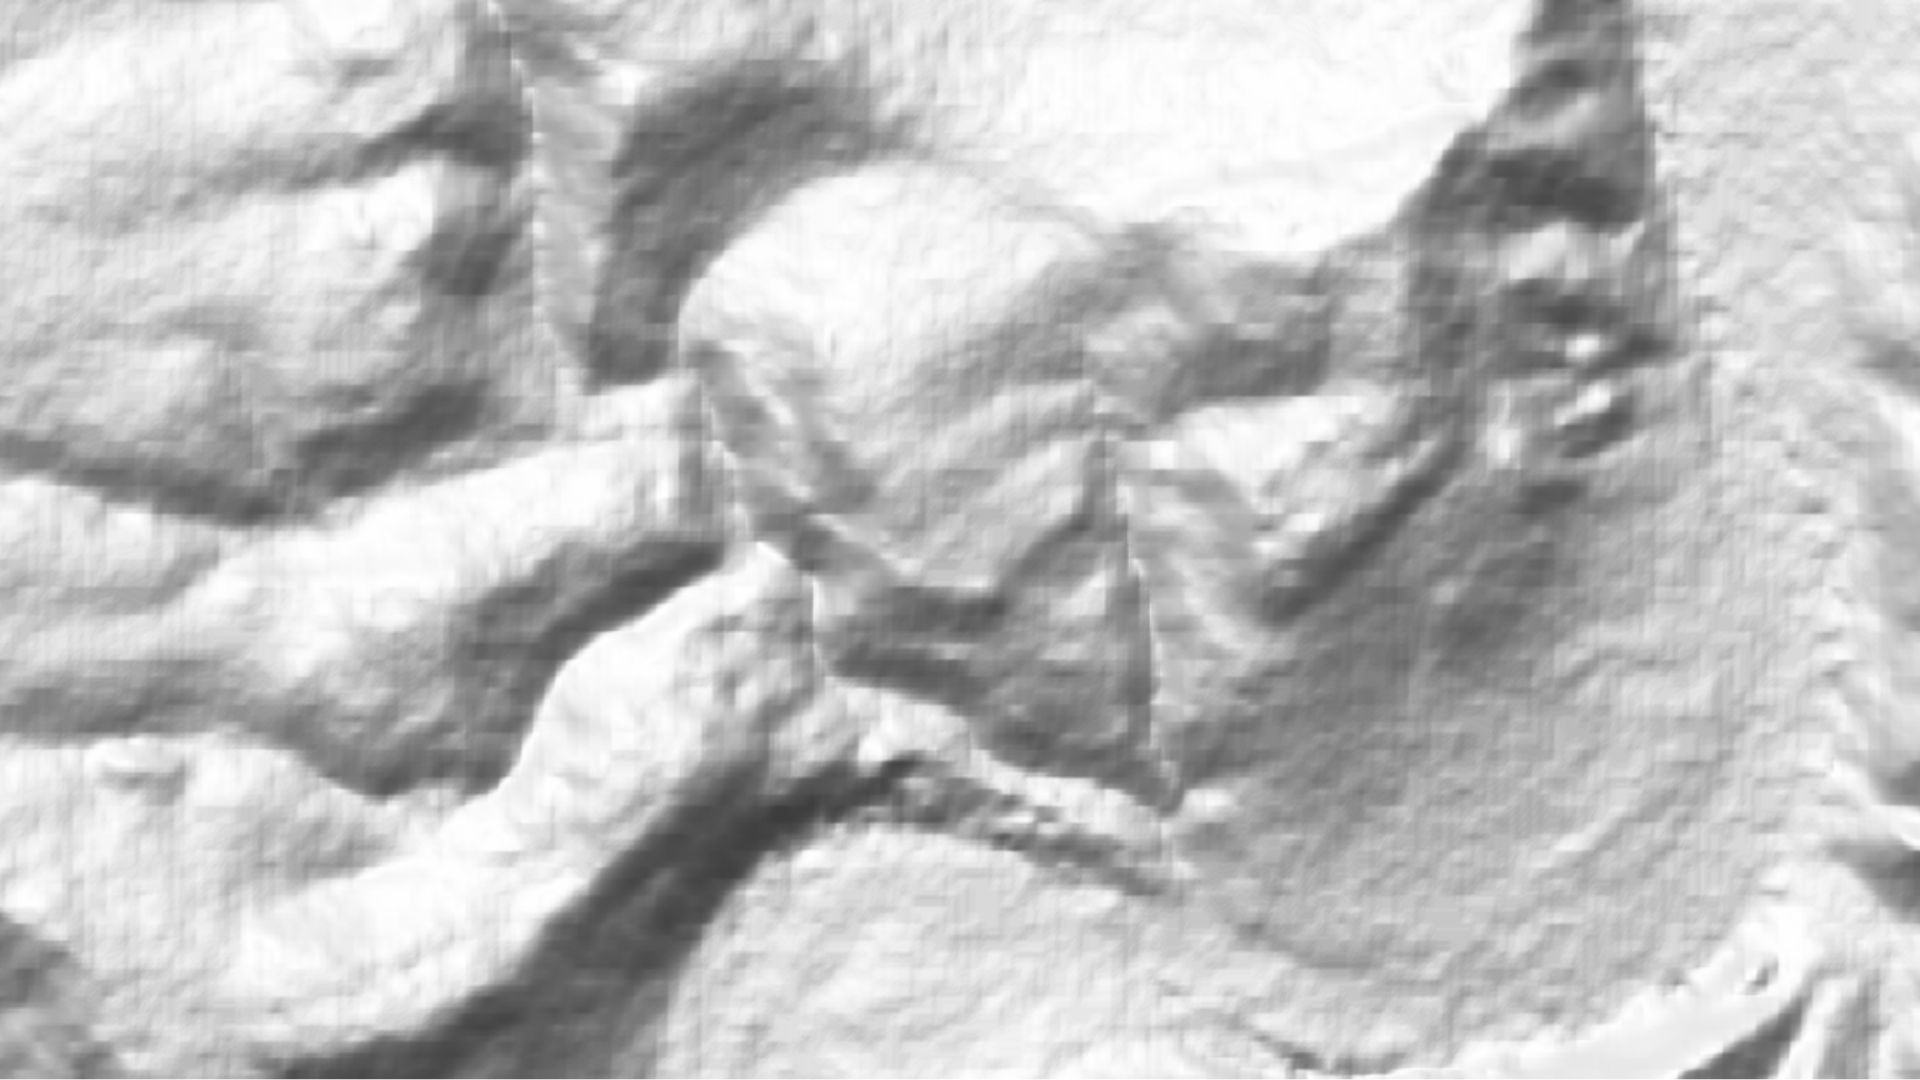
Hillshade Analysis is a geospatial technique used to visualize terrain relief by simulating the effects of sunlight on a three-dimensional surface model. The output is a grayscale raster depicting shadow and illumination patterns based on the angle and direction of virtual light sources. Darker areas represent shadows, while lighter areas indicate illuminated slopes. Hillshade models enhance terrain visualization, highlighting landforms like ridges and valleys.
Slope Analysis
The Slope Analysis is used to quantify and visualize the inclination of a terrain's surface. It calculates the rate of elevation change per unit horizontal distance, expressing terrain steepness. The output, presented as a raster dataset, assigns slope values ranging from 0 (flat) to 90 degrees (vertical). Darker shades represent gentle slopes, while lighter shades indicate steeper areas.
Binary Classification
Binary Classification is a operation designed to categorize data into two distinct classes or categories. The output is a decision boundary that separates the two classes based on features extracted from the input data. Binary Classification is widely employed in various applications, such as spam detection, disease diagnosis, and sentiment analysis.

Crop Raster
Crop Raster is an operation utilized to extract a specific region or area of interest from a larger raster dataset. This technique allows you to focus on and analyze a particular subset of spatial information within the raster. The output is a new raster dataset containing only the selected portion, effectively cropping out irrelevant or unwanted areas.
Point Extraction
Point Extraction is an operation designed to isolate and extract specific data points from a larger dataset. This method is particularly useful when focusing on precise locations of interest within a spatial dataset. The output is a subset containing only the selected points, streamlining the analysis and allowing for targeted examination.
Zonal Statistics
Zonal Statistics enables computation of statistical information within predefined zones or regions of interest within a raster dataset. This method allows for the extraction of statistical metrics, such as mean, median, maximum, minimum, or standard deviation, based on the values of raster cells within specified zones. By summarizing raster values within designated regions, Zonal Statistics aids in understanding the spatial distribution of attributes and supports informed decision-making in diverse fields.
WMS to Raster
WMS to Raster conversion transforms data from a Web Map Service (WMS) format into a raster dataset. WMS is a standard protocol for serving georeferenced map images over the internet. The conversion to raster format involves capturing the visual representation of the map layers and converting them into a grid of pixels with associated geospatial information.
This process is valuable for integrating external servers, enabling further analysis and visualization.
Raster to Vector
Raster to Vector transforms raster data, represented as a grid of pixels, into vector data, composed of points, lines, and polygons. This conversion is crucial for extracting geometric features and enhancing the versatility of spatial data.
Summing Up
The various geospatial techniques discussed here play vital roles in analyzing and processing spatial data. These methods enable the extraction, transformation, and visualization of geographic information, offering valuable insights into terrain characteristics, data categorization, and statistical patterns.
Whether it's understanding the topography, categorizing data into binary classes, extracting specific points or regions, or converting between different data formats, these techniques collectively contribute to informed decision-making, spatial modeling, and efficient handling of geospatial data across diverse applications and industries.
Sign up to try the raster analyses today: Sign up


