This guide will walk you through the basics of using Atlas in six steps. If you’re looking for a comprehensive resource to Atlas mastery, check out our Atlas Academy.
People use Atlas for everything from biodiversity mapping to infrastructure planning.
Step 1: Create your first project
Every project contains all of the information you need for your workflow, and is interactive and flexible enough to adapt to your team’s changing needs.
To create your first project:
- On the Atlas home screen (make sure you’re logged in), click on the button “New project”
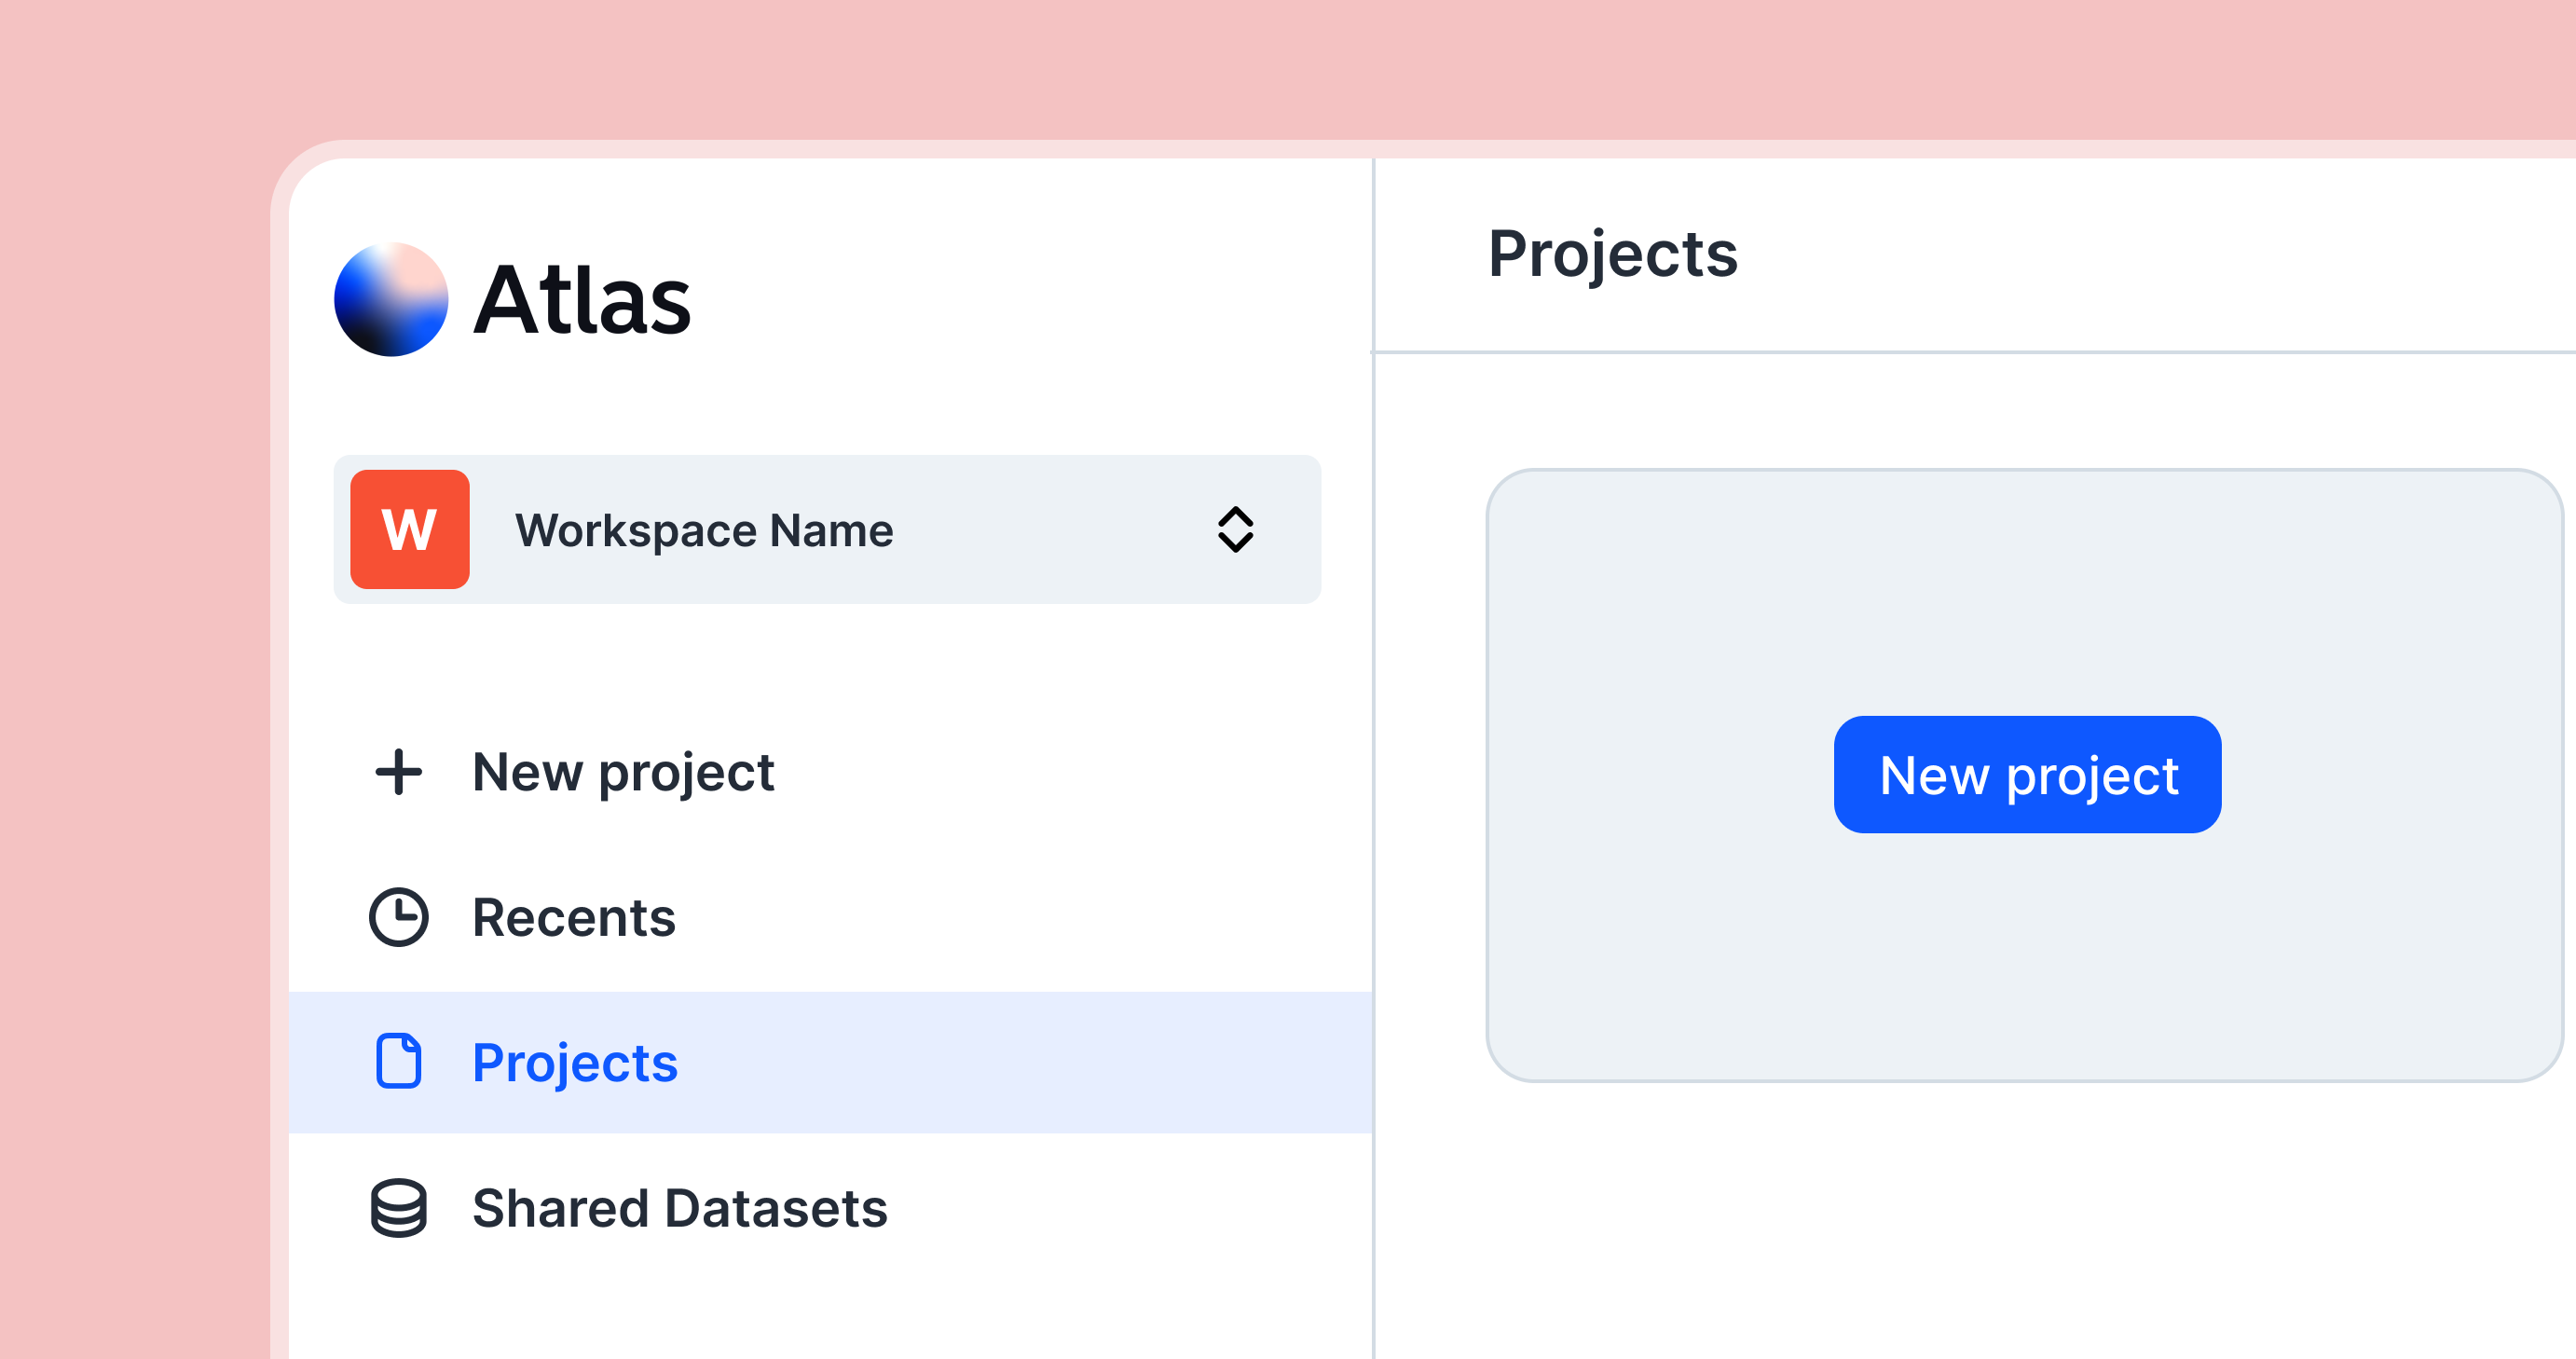
If you want a starting point, you can explore our ready-to-use templates.
Understand the interface
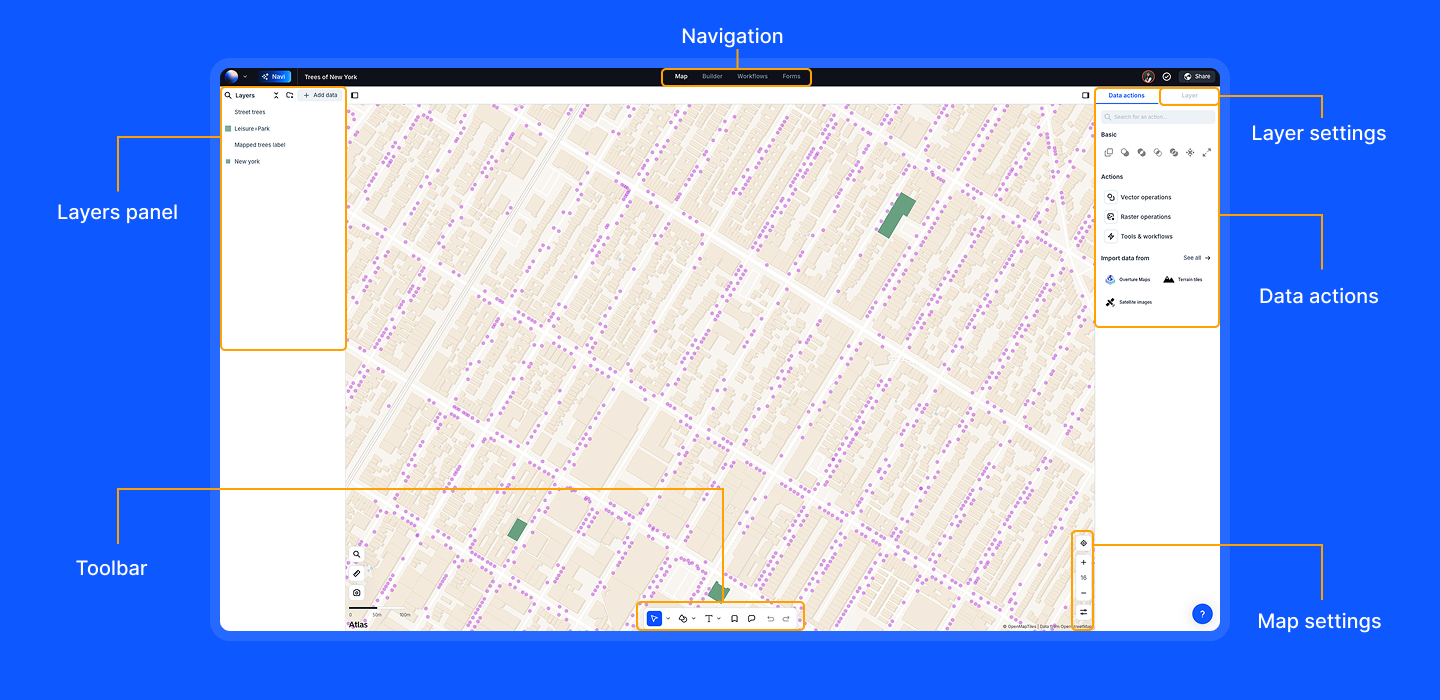
Before adding data, take a moment to get familiar with your workspace.
Atlas projects have four main modes, accessible from the top navigation menu:
-
Map – where you add, style, and analyze data
- Left panel: Layers list showing all your datasets
- Right panel: Data actions tab with spatial operations
- Bottom toolbar: Map tools (navigation, drawing, text, comments, bookmarks, undo/redo)
-
Builder – design custom interfaces for your maps
- Create user-friendly dashboards and applications
- Choose from layout templates or start from scratch
-
Workflows – build automated data processing pipelines
- Visual canvas for connecting data operations
- Drag-and-drop blocks for geoprocessing, analysis, and transformations
-
Forms – collect structured data from users
- Create custom data collection forms
- Responses automatically populate your datasets
You’ll get hands-on with each of these in the next steps.
Ready? Let’s add some data.
Step 2: Add your data
At the core of any spatial workflow is data - the individual pieces of information that are specific for you and your business.
You can add data by clicking on the "Add data" button in the Layers panel (left sidebar). You can add data through 4 different methods: (1) Upload File, (2) Connect to External Sources, (3) Import from Shared Datasets, (4) Import from Atlas Data Hub. You can also explore sample datasets.
Upload files
Atlas supports a wide range of file formats, with support for files up to 1 GB in size. You have the option to upload files in their original format or choose to compress them into .zip files.
| Format | File Extensions/Notes |
|---|---|
| GeoJSON | .geojson |
| KML/KMZ | .kml, .kmz |
| Geopackage | .gpkg |
| ESRI Shapefile | .shp (include .dbx and .shx files) |
| Geodatabase | Folder ending in .gdb (must be zipped) |
| GML | .gml |
| Spreadsheets | .csv |
| TIFFs | .tif, .tiff, .dem |
| Images | .png, .jpg, .gif |
Connect to external sources
The External Connections allows you to connect to and integrate data from various external sources.
Supported connections:
- OGC Services
- Feature Server
- Google Sheets
- Smartsheet
- PostgreSQL
- BigQuery
- Snowflake
- Databricks
- MySQL
- SQL Server
- Oracle
Once connected, all external data sources are listed in your project under Connections.
Additionally, you can also fetch data from 3rd party integrations, e.g. OpenStreetMap or Overture Maps.
Shared Datasets
Shared Data represents shared datasets that are available to the entire workspace and synced across projects.
New datasets can be uploaded to Shared Datasets in the Shared Datasets tab in the home screen of Atlas. You can also convert an existing project datasets into a Shared dataset.
Atlas Data Hub
Access 500+ ready-to-use datasets from public available sources. Most of these datasets are external WMS sources.
Dataset Types
| Feature | Vector | Raster | External |
|---|---|---|---|
| Editable | ✅ Yes | ❌ No | ❌ No |
| Used in analysis | ✅ Yes | ✅ Yes | ❌ No |
| Styling options | ✅ Full styling | ✅ Limited styling | ✅ Basic styling |
| Live data | ❌ No | ❌ No | ✅ Yes |
| Examples | Points, roads, zones | Elevation, imagery | WMS, WMTS, APIs |
Step 3: Style data
Once your data is added to the map, it’s time to make it look the way you want. Styling helps make your map more readable, useful, and visually appealing.
To get started, click on the dataset you want to style in the Data list, then head to the Layer tab in the right sidepanel.
You can control how it looks based on several options:
Visualization type
This controls how your data appears on the map. Choose the style that best fits your data type and story:
- Standard: Show your data using points, lines, or polygons based on the geometry of your dataset.
- Marker: Great for point data. Use custom markers, icons, or emojis.
- Heatmap: Best for dense point data. Shows concentrations using a gradient of color.
You can switch between visualization types anytime to see what fits best.
Zoom visibility
Control when your data appears on the map. Set a min and max zoom level so layers only show at the right scale.
Useful if you want:
- Points to disappear when zoomed out.
- Details to appear only when zoomed in.
Colors
Change the color of your data to match your story or branding.
Options:
- Set a single color for all features.
- Style by category (e.g., type of location).
- Style by numeric value (e.g., population) using gradients.
You can also adjust opacity and stroke width for lines and polygons.
Labels
Turn on labels to display text and icons on your map.
- Choose which column to use as the label.
- Customize font size and color.
- Labels can appear always, or only when zoomed in.
Popup
Popups show details when a user clicks on a feature.
- Choose which fields to show.
- Reorder fields.
- Add static text or custom descriptions.
You can use this to highlight key info or create interactive experiences.
Legend
Add a legend so users know what your colors or styles mean.
- Automatically generated if you use categories or values.
- Can be edited to update titles or categories.
Step 4: Edit and analyze
After styling your data, you can dig deeper. Edit, calculate, and run spatial operations directly in the browser.
Data Table
Each vector dataset has a full attribute table behind it. Click on the dataset, then open the Data Table tab to:
- Edit existing values directly in the table
- Add new fields with types like:
- Text – freeform strings
- Number – for calculations or visualizations
- Boolean – true/false
- Single Select – dropdown with fixed options
- Date – date picker input
- Image – store image URLs or upload thumbnails
You can also filter rows, sort values, or export the table as CSV.
Spatial Operations
Do serious GIS work—right from your browser. Select a dataset, go to the Data Actions tab, and choose from a wide range of spatial operations:
- Buffer – expand features by a set distance
- Intersection – find where layers overlap
- Boundary – convert filled shapes into outlines
- Contour – generate elevation lines from raster
- Zonal statistics – summarize raster values within polygons
- Travel time analysis – show how far you can go in X minutes from a point
Every operation creates a new dataset, so your original stays safe.
Step 5: Build interface
Now that your data is ready — it's time to shape the user experience. Click on the Builder link in the top navigation menu to design how your map should look for others.
When you first enter Builder mode, you'll be prompted to choose a layout:
- Layout templates – Pre-made designs including Data Portal, Discover, Analytics, or Blank
- Workspace templates – Custom templates saved in your workspace
- Desktop or Mobile – Toggle between responsive designs
After selecting a layout (or choosing Blank to start from scratch), you can add sections and widgets to customize your interface. Sections are containers that hold content, and you can add them by clicking the floating plus buttons. Then drag-and-drop widgets into the sections.
Widget examples
- Filters – Let users filter the map by category, number, or date
- Bookmarks – Create quick zoom-ins to key locations
- Graphs – Show data insights with charts linked to the map
- Text – Add headers, descriptions, and notes
- Legend – Custom or auto-generated
- Buttons – Trigger actions or link to external pages
Step 6: Bring your team along
Now that your spatial app is built, it’s time to bring your team along. You can invite collaborators to view, update and edit your data.
Depending on your teammates’ needs, choose from different permission levels:
- Full seat has full edit access and control - they can make adjustments to the project, in addition to adding, editing and deleting data
- Viewer seat allows viewers to see the information, and leave comments, but not alter it directly.
Pro tip: Publish the app and share with a link If you need surface specific information to someone quickly, publish the map and share a link instead of adding them as collaborators.
Invite team members to your workspace
Instead of inviting specific users to each project, you can invite team members directly to your workspace. These users will then have access to all projects that are shared in the workspace.
You can still control access:
- Keep projects private until you’re ready to share
- Use permissions (Viewer or Full) to manage what each team member can do
This gives you flexibility and saves a ton of admin time.
Recap
You’ve made it! As you get more comfortable with Atlas, everything else - adding or updating data, creating your next project, and even leveling up with advanced features like automations and forms - will start clicking into place.
And if you get stuck at any step, you can view in-depth guides or explore our courses.